
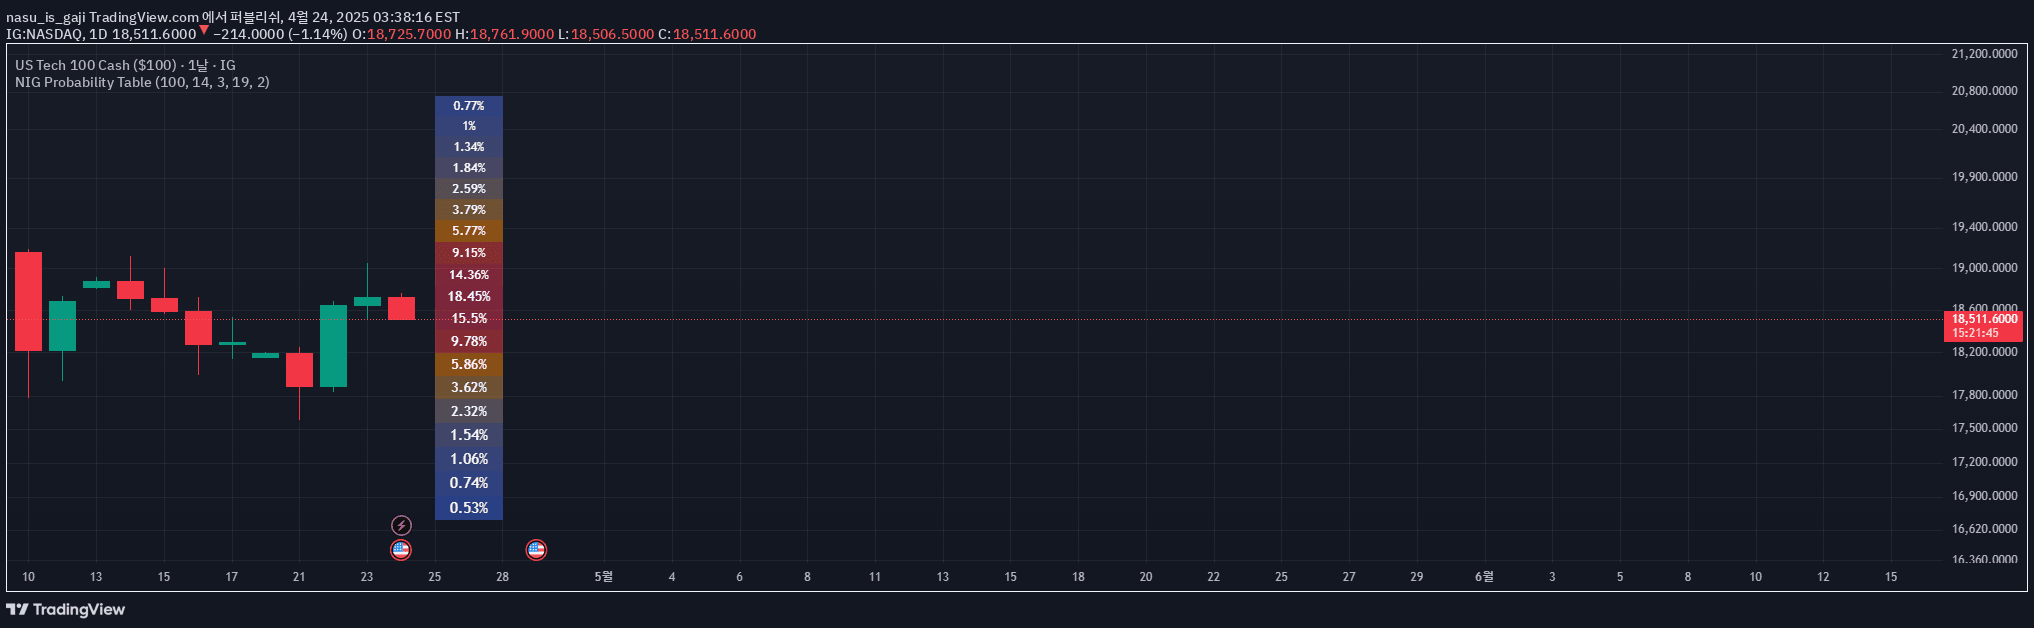
A probabilistic trading indicator using Normal-Inverse Gaussian distribution to estimate future price movements by analyzing log returns and calculating real-time return probability distributions.
Explore complementary indicator rolesHow it works
The Normal-Inverse Gaussian (NIG) probability table operates by first computing log returns from price data using a sliding window approach. It then estimates key distribution parameters including tail heaviness (α), skewness (β), scale (δ), and location (μ).
The indicator uses a numerically approximated modified Bessel function to calculate the probability density function. By analyzing these parameters, it generates a dynamic probability table showing potential future return ranges. The calculation normalizes total probability across different bins to ensure interpretable results
Why it may be useful
This indicator provides traders with a sophisticated probabilistic framework for understanding potential price movements. By quantifying return probabilities through advanced statistical modeling, it offers insights beyond traditional trend indicators.
The NIG distribution captures complex market behaviors including fat tails and asymmetric return patterns. Traders can use this to assess potential risk and estimate likelihood of different price scenarios. It helps in understanding market uncertainty and potential extreme events more precisely than standard linear models
When to explore it
The NIG probability table works best in markets with non-linear return distributions and potential for sudden price movements. It is particularly useful during periods of high market uncertainty or when trading assets with historically complex return patterns.
Traders should apply this in volatile markets like cryptocurrencies, emerging market stocks, or during economic news events. It is most effective when combined with other technical and fundamental analysis tools. The indicator provides maximum value when analyzing medium to long-term price trends
Keep exploring
What we’ve verified
Access, alerts and repainting behaviour have not been independently verified for this indicator. Check the creator’s current publication and settings.
General descriptions and classifications are recovered research. Verified details above identify the specific checks we have completed. Check the creator’s current publication for later changes.


