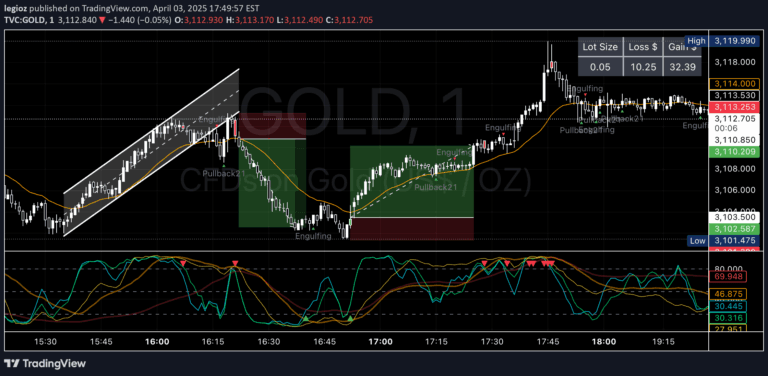
A probability calculation script that determines the likelihood of price reaching a specific level within one candle using Normal Distribution analysis and statistical probability.
Explore complementary indicator rolesHow it works
The script calculates probability using the Normal Distribution Probability Table by taking the Average True Range or Standard Deviation of past bars. It computes a z-score by comparing the price level to the current close price and the ATR or Standard Deviation. The z-score is then matched against the probability table to determine the likelihood of price movement.
Once the z-score is calculated, the script converts it to a percentage by multiplying by 100 and subtracting from 100 to represent the probability. This approach allows traders to visualize the probability of price reaching a specific level within a single candle, presenting the results through color-coded lines on the chart.
Why it may be useful
This probability calculation provides traders with a statistical approach to understanding potential price movements, which can significantly enhance risk management and trading decision-making. By quantifying the likelihood of price reaching certain levels, traders can make more informed choices about entry, exit, and stop-loss strategies.
The script's versatility in analyzing both bullish and bearish scenarios makes it a valuable tool for various trading styles. It offers insights that go beyond traditional technical analysis by providing a mathematical perspective on potential price behavior, which can help traders develop more precise and data-driven trading approaches.
When to explore it
The probability script is most effective for traders seeking precise risk assessment and probability-based trading strategies, particularly in volatile or uncertain market conditions. It is especially useful for options traders, scalpers, and day traders who need to make quick, statistically informed decisions about potential price movements.
Traders can leverage this tool when developing hedging strategies, setting stop-loss levels, or evaluating the potential risk and reward of a trade. It is particularly valuable in markets with significant price fluctuations, where understanding the statistical probability of price movement can provide a critical edge in trading decision-making.
Keep exploring
What we’ve verified
Access, alerts and repainting behaviour have not been independently verified for this indicator. Check the creator’s current publication and settings.
General descriptions and classifications are recovered research. Verified details above identify the specific checks we have completed. Check the creator’s current publication for later changes.