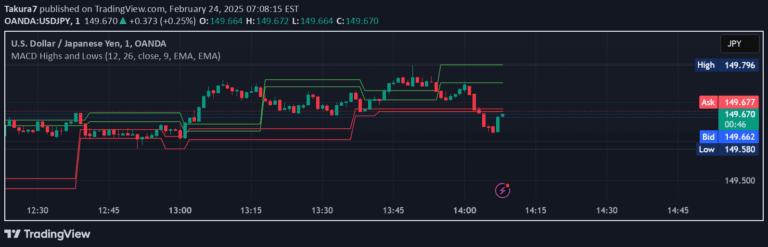
A multi-data oscillator tool that allows traders to visualize different indicators like RSI, CCI, and LOC with customizable length and smoothing parameters.
Explore complementary indicator rolesHow it works
The multi-data oscillator functions by integrating multiple technical indicators into a single comprehensive visualization tool. Traders can select from RSI, CCI, LOC, or a custom formula that tracks data location relative to past values, and even create an average of these indicators.
The tool allows customization of both indicator length and smoothing factor, enabling traders to fine-tune the oscillator's sensitivity and responsiveness. A unique gradient color feature adds depth to the visualization, changing based on deviation and variance of the calculated lines, with the average line displayed more prominently.
Why it may be useful
This oscillator provides traders with a flexible and adaptable tool for analyzing market momentum and potential trend changes across different timeframes. By combining multiple indicators, it offers a more comprehensive view of market dynamics than single-indicator approaches.
The customizable nature of the tool allows traders to tailor their analysis to specific market conditions, trading styles, and individual preferences. The gradient color feature helps quickly identify market volatility and potential trend shifts, making complex market data more intuitive and easier to interpret.
When to explore it
The multi-data oscillator is most effective when traders need a versatile tool for analyzing market momentum across different timeframes and asset classes. It is particularly useful during periods of market uncertainty, where multiple indicator perspectives can provide clearer insights into potential trend movements.
Traders can leverage this tool in both trending and ranging markets, adjusting the length and smoothing parameters to match current market conditions. Its flexibility makes it suitable for scalping, day trading, and swing trading strategies, allowing traders to adapt their analysis to short-term and medium-term market dynamics.
Keep exploring
What we’ve verified
Access, alerts and repainting behaviour have not been independently verified for this indicator. Check the creator’s current publication and settings.
General descriptions and classifications are recovered research. Verified details above identify the specific checks we have completed. Check the creator’s current publication for later changes.