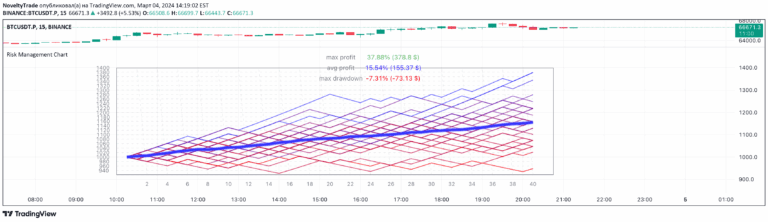
Risk Management Chart
A trading tool that simulates random trades and visualizes risk management strategies by generating multiple trade scenarios with different win/loss probabilities and equity calculations.
Explore 11,183 indicators. Filter beyond the obvious.
Discover the tools that fit the way you trade.
11,183 tools to explore
A trading tool that simulates random trades and visualizes risk management strategies by generating multiple trade scenarios with different win/loss probabilities and equity calculations.
A multi-length RSI screener that analyzes up to 240 tickers simultaneously, tracking RSI overbought and oversold conditions across different periods.
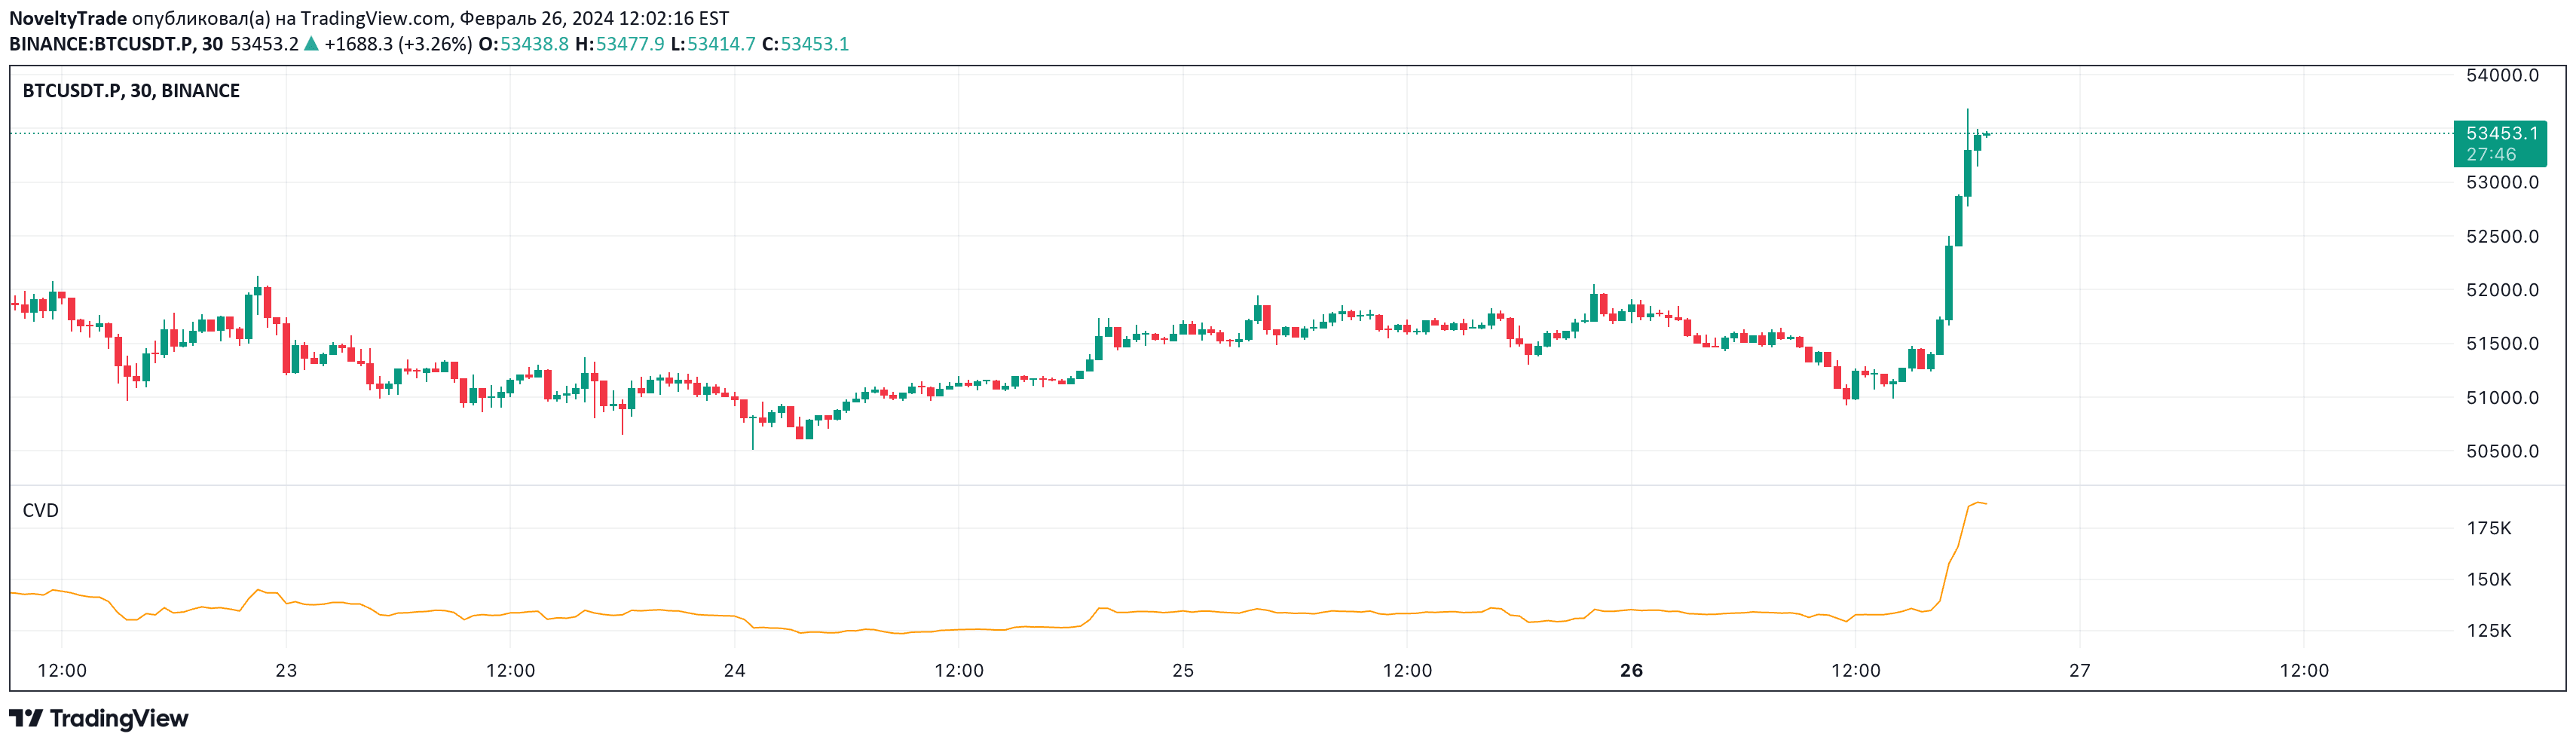
Cumulative Volume Delta (CVD) tracks net buying and selling pressure by calculating the running total of volume differences between bullish and bearish price movements.
A comprehensive script providing detailed technical and fundamental information about a trading symbol, offering quick insights into market characteristics and trading parameters.
Likes, views, and comments are historical TradingView snapshots. They describe attention, not trading performance.