
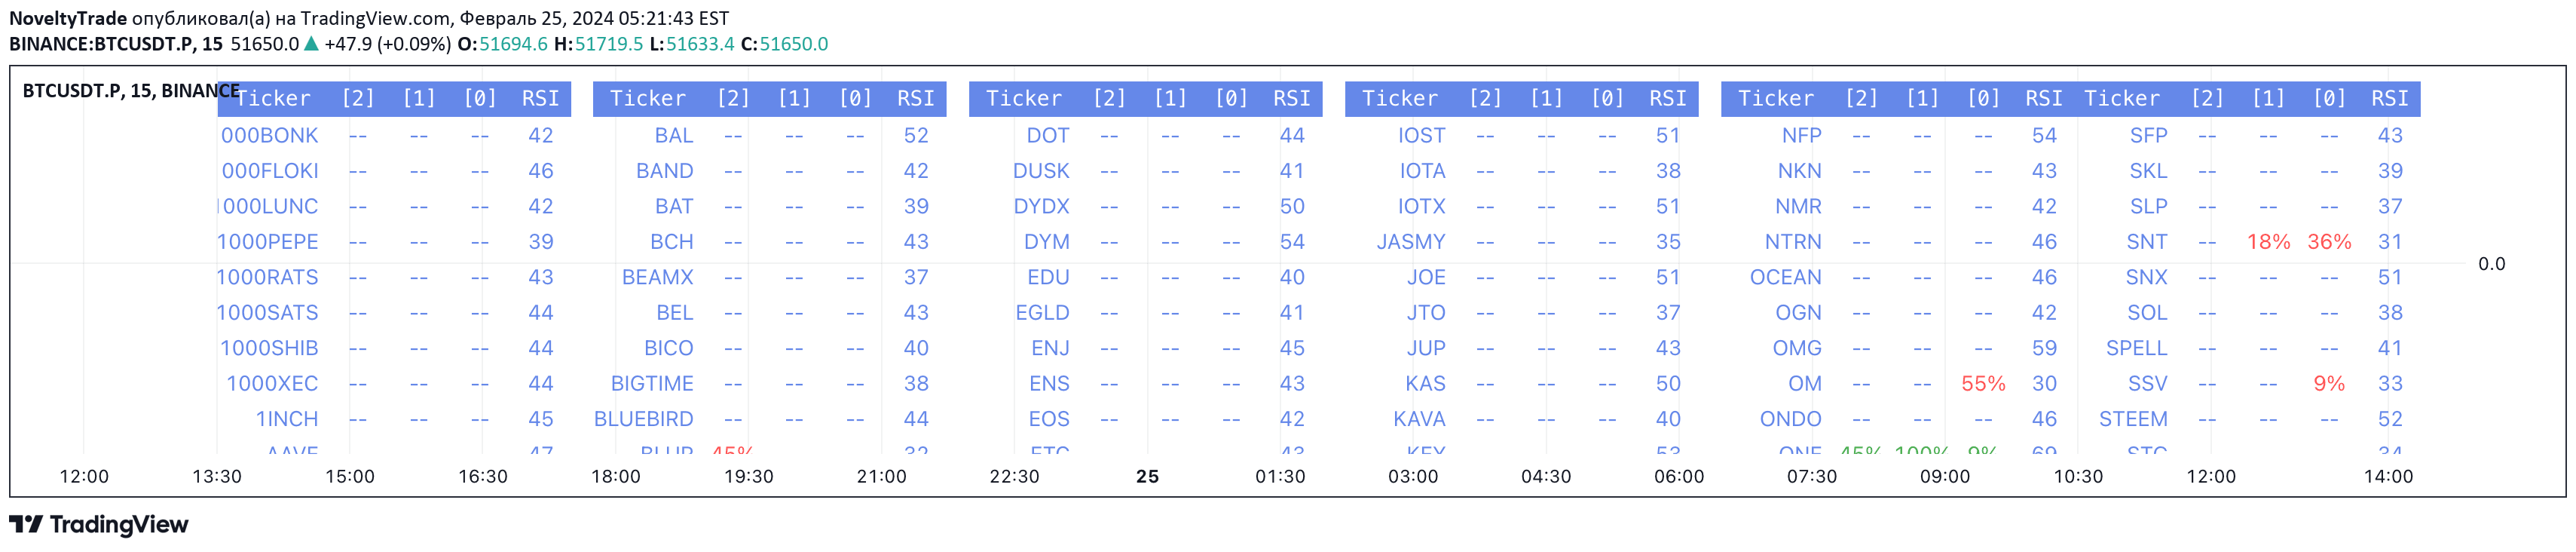
A multi-length RSI screener that analyzes up to 240 tickers simultaneously, tracking RSI overbought and oversold conditions across different periods.
Explore complementary indicator rolesHow it works
The RSI multi-length screener uses multiple RSI periods to analyze price momentum across different timeframes. It calculates RSI values for various lengths simultaneously, allowing traders to compare and assess the indicator's performance across multiple periods.
The tool examines up to 240 tickers, tracking when RSI enters overbought or oversold zones and then returns to neutral levels. By aggregating RSI data from different periods, traders can gain a more comprehensive view of potential trading signals and market conditions.
Why it may be useful
This multi-length RSI screener provides traders with a more nuanced view of market momentum by analyzing multiple timeframes simultaneously. It helps identify potential entry and exit points by showing when RSI moves from extreme conditions back to neutral levels across different periods.
The tool's ability to screen multiple tickers quickly allows traders to efficiently scan market conditions and identify potential trading opportunities. By comparing RSI performance across different lengths, traders can develop more robust and comprehensive trading strategies.
When to explore it
The multi-length RSI screener is most effective in volatile markets with clear trending or ranging conditions. It works best when traders want to quickly assess momentum across multiple securities and timeframes, providing a comprehensive market overview.
Traders should use this tool when they need to screen multiple tickers simultaneously and want to identify potential momentum shifts. It is particularly useful for day traders and scalpers looking for quick entry and exit signals based on RSI movement across different periods.
Keep exploring
What we’ve verified
Access, alerts and repainting behaviour have not been independently verified for this indicator. Check the creator’s current publication and settings.
General descriptions and classifications are recovered research. Verified details above identify the specific checks we have completed. Check the creator’s current publication for later changes.


