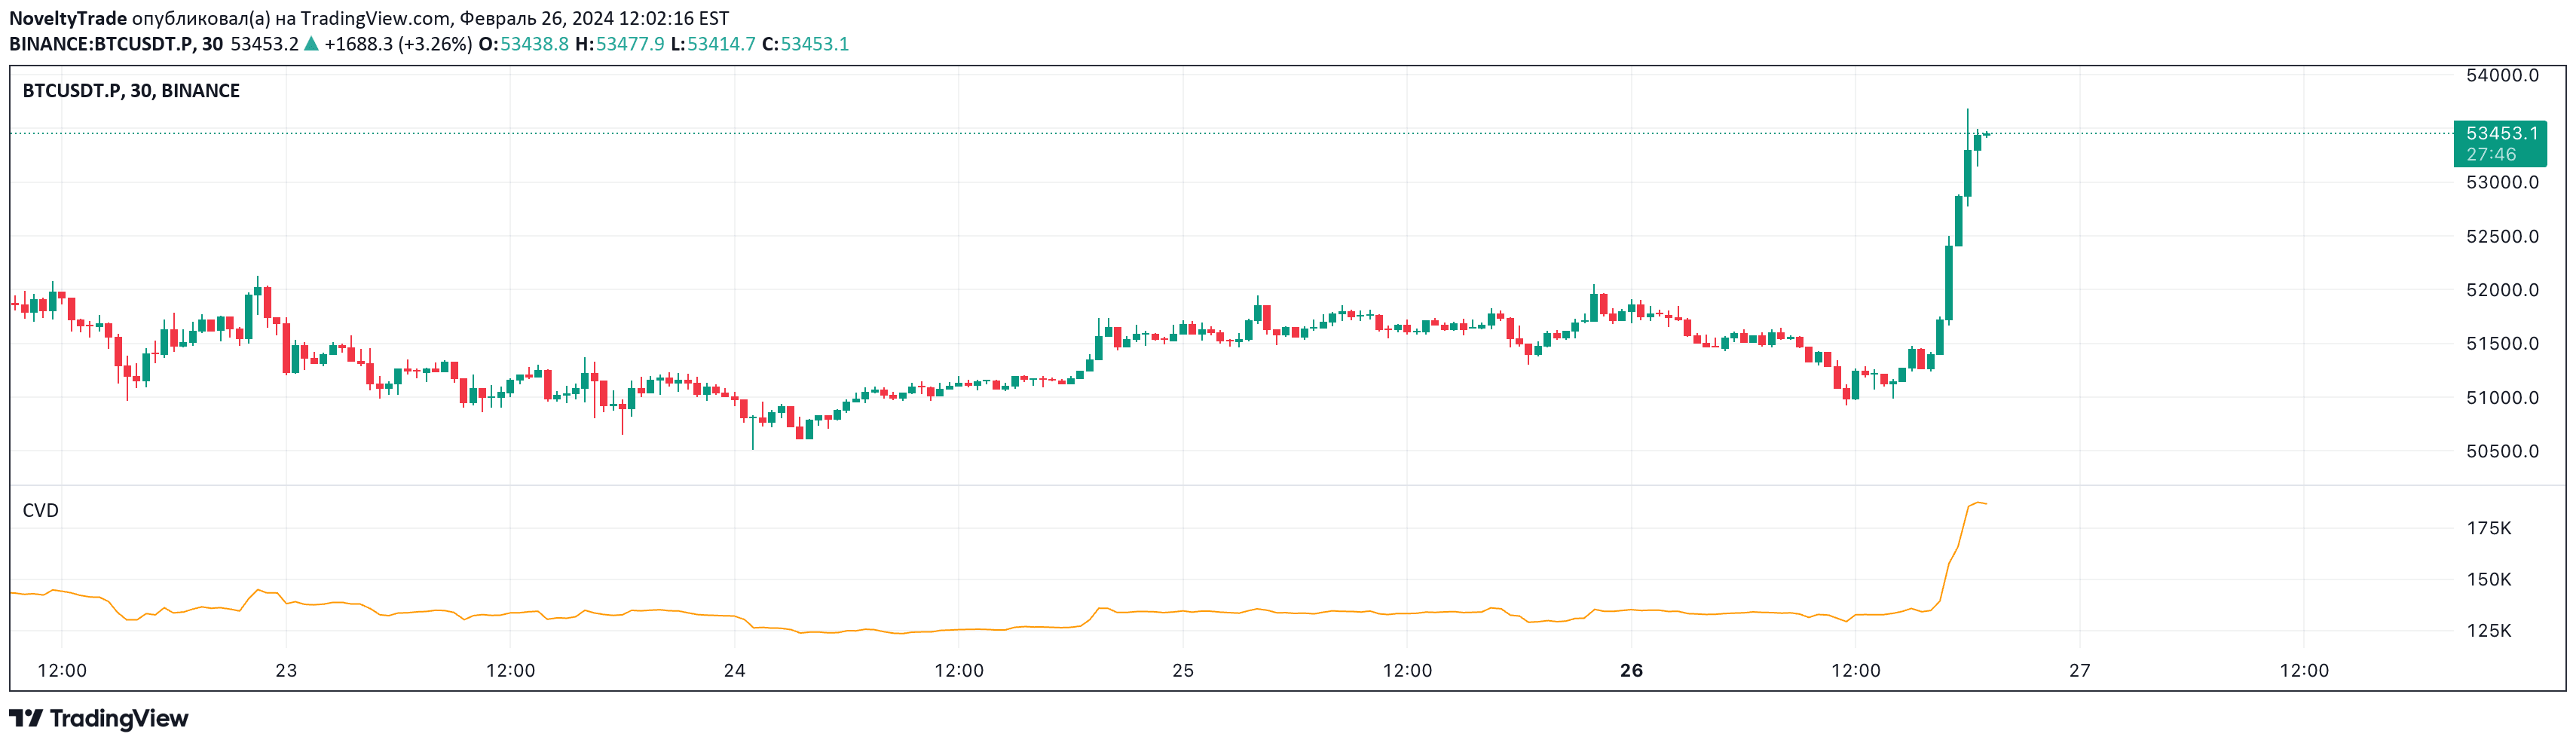
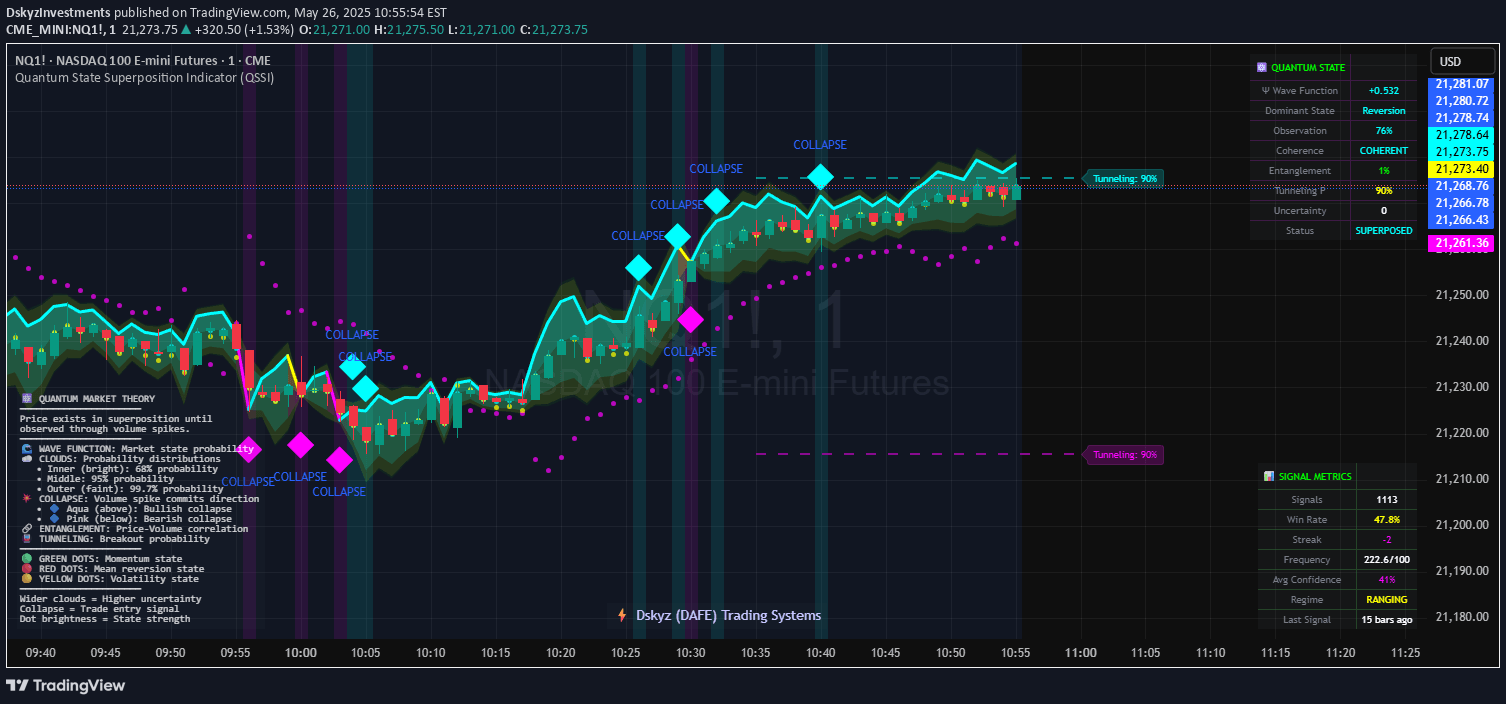
Enhanced CVD indicator allowing multi-exchange volume flow comparison with customizable symbol selection and normalization capabilities for comprehensive trading analysis.
Explore complementary indicator rolesHow it works
The LTF CVD (Cumulative Volume Delta) analyzes trading volume by tracking the net volume flow between buyers and sellers at different price levels. It calculates the difference between volume traded at ask and bid prices, creating a cumulative representation of market sentiment and order flow dynamics.
By offering manual symbol selection and normalization features, traders can compare volume characteristics across multiple exchanges and trading instruments. The indicator plots the volume delta line, providing visual insights into potential price movement momentum and market participation.
Why it may be useful
Volume flow analysis is crucial for understanding market psychology and identifying potential trend reversals or continuations. The enhanced CVD allows traders to gain deeper insights into market dynamics by comparing volume characteristics across different trading instruments and exchanges.
By providing a normalized view of volume delta, traders can effectively assess relative market strength and weakness. This comprehensive approach helps traders make more informed decisions by revealing underlying market sentiment beyond traditional price action analysis.
When to explore it
The LTF CVD works best during periods of high market liquidity and significant trading activity, such as during major market sessions or around important economic announcements. Traders can leverage this indicator when comparing volume flows between futures and spot markets or analyzing multiple related securities.
It is particularly useful for identifying potential trend confirmations, detecting divergences, and understanding institutional trading dynamics. Traders should combine this indicator with other technical analysis tools to validate signals and improve overall trading strategy effectiveness.
Keep exploring
What we’ve verified
Access, alerts and repainting behaviour have not been independently verified for this indicator. Check the creator’s current publication and settings.
General descriptions and classifications are recovered research. Verified details above identify the specific checks we have completed. Check the creator’s current publication for later changes.