
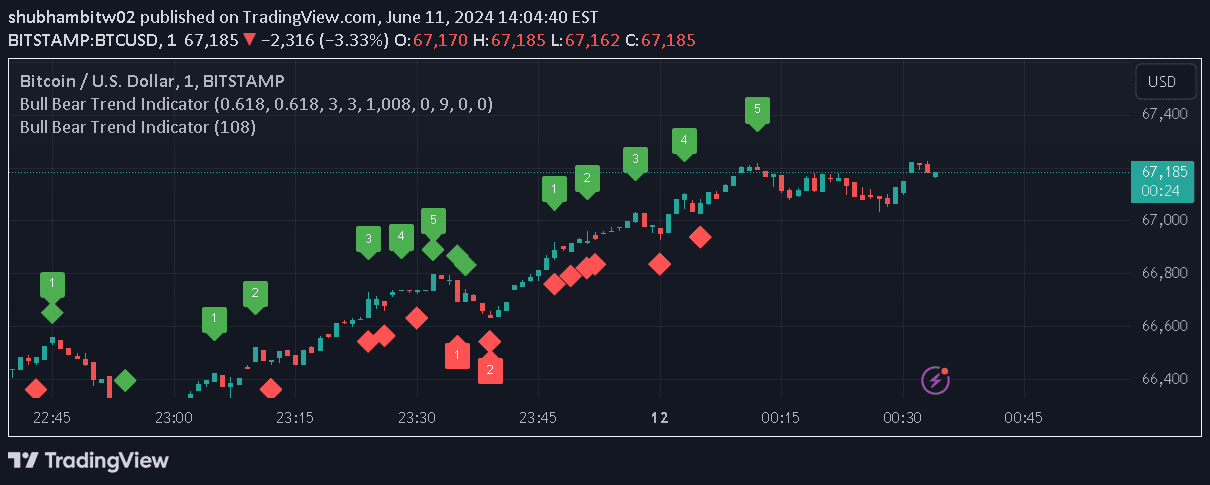
A specialized indicator that identifies and labels swing points in price trends, highlighting higher highs, lower lows, and potential trend reversals across different market conditions.
Explore complementary indicator rolesHow it works
The Swing Point Indicator operates by analyzing price action and identifying critical trend points through a systematic approach of tracking higher highs and lower lows. It utilizes a customizable lookback period, typically defaulting to 108 candles, to assess price movements and determine trend direction.
The indicator selectively labels significant price points with color-coded markers, using green labels for uptrend highs and red labels for downtrend lows. Each labeled point requires confirmation by two subsequent closed candles, ensuring reliability and reducing false trend signals. Traders can also enable options for identifying equal highs and lows, providing additional market insight.
Why it may be useful
The Swing Point Indicator provides traders with a sophisticated visual tool for understanding market dynamics and trend progression. By clearly highlighting critical price levels, it enables traders to quickly recognize potential trend reversals and maintain a strategic perspective on market movements.
Its comprehensive approach allows traders to identify key support and resistance levels, understand trend strength, and make more informed trading decisions. The indicator's flexible configuration and precise labeling mechanism help traders reduce emotional trading and rely on structured, data-driven analysis of price action.
When to explore it
The Swing Point Indicator is most effective in markets with clear trending characteristics, where price movements demonstrate consistent directional momentum. It performs exceptionally well in liquid markets with sufficient price volatility, such as major currency pairs, stock indices, and widely traded commodities.
Traders should utilize this indicator during periods of established trends, when price is making consecutive higher highs or lower lows. It is particularly valuable when combined with other technical analysis tools to confirm signals and provide additional context for potential trade entries and exits.
Keep exploring
What we’ve verified
Access, alerts and repainting behaviour have not been independently verified for this indicator. Check the creator’s current publication and settings.
General descriptions and classifications are recovered research. Verified details above identify the specific checks we have completed. Check the creator’s current publication for later changes.


