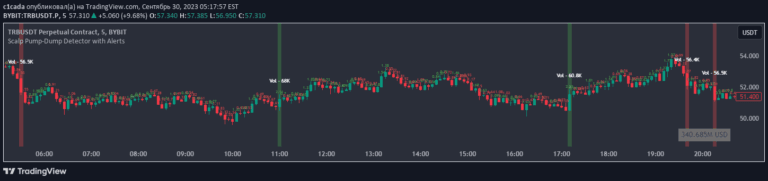
Scalp Pump-Dump Detector with Alerts
A script that tracks percentage movements of chart candles and identifies abnormal price movements, allowing traders to set alerts for significant price changes.
Explore 11,183 indicators. Filter beyond the obvious.
Discover the tools that fit the way you trade.
11,183 tools to explore
A script that tracks percentage movements of chart candles and identifies abnormal price movements, allowing traders to set alerts for significant price changes.
A price action indicator that combines previous day's high/low levels with a three-candle pattern analysis to identify potential market reversals or continuations.
A dynamic trend filter using multiple moving averages to identify market momentum, trend direction, and potential consolidation periods through color-coded histogram signals.
A technical indicator that measures trend strength by comparing average bullish and bearish candle ranges, generating buy and sell signals when these lines cross.
A TradingView volume indicator that colors volume bars based on their magnitude relative to average volume and standard deviation, helping traders visualize trading activity levels.
A unique charting tool that tracks candles by calendar day instead of market days, offering customizable start dates and display options for traders seeking alternative visualization.
A multi-symbol, multi-timeframe candle state analysis tool that tracks price action across two instruments using The Strat's three core candle scenarios.
A multi-timeframe support and resistance indicator that automatically plots dynamic price zones based on recent market structure, providing clear visual insights across different timeframes.
A crypto trading indicator that tracks the price premium between Binance perpetual futures and Coinbase spot BTC, revealing market sentiment and potential arbitrage opportunities.
A trading visualization tool that maps higher time frame candles onto lower time frame charts, providing a comprehensive view of price action and market structure across different time intervals.
A simple indicator plotting previous 15-minute candle highs/lows and current candle open across different timeframes, providing quick visual reference for potential support and resistance levels.
A trading script that calculates the Effective Fed Funds Rate targets by subtracting them from 100, providing traders with a quick visual reference for STIR and Treasury market relationships.
Likes, views, and comments are historical TradingView snapshots. They describe attention, not trading performance.