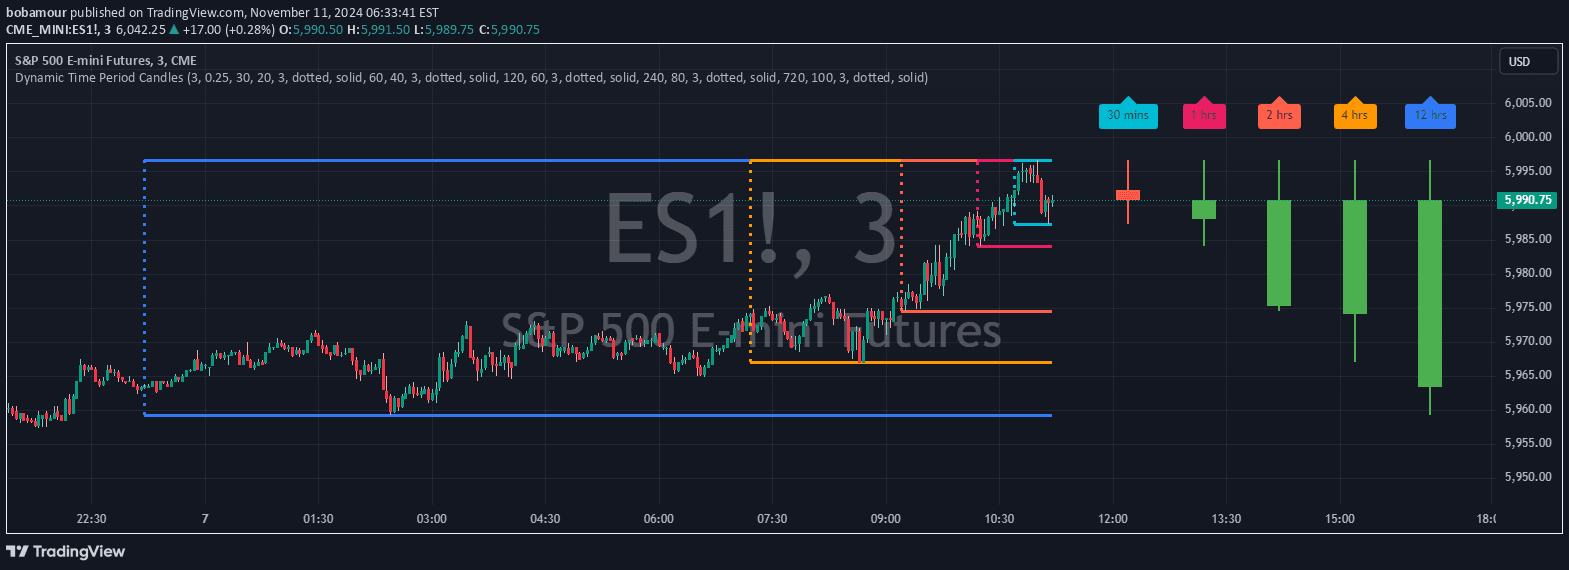
A unique charting tool that tracks candles by calendar day instead of market days, offering customizable start dates and display options for traders seeking alternative visualization.
Explore complementary indicator rolesHow it works
This candle tracking signal allows traders to reshape traditional candlestick visualization by using calendar days as the primary measurement instead of market trading sessions. Users can set a custom start date for candle formation, enabling more flexible charting that breaks away from standard market-based timeframes.
The tool provides additional customization through a candle multiplier and color options for up and down movements. Traders can overlay the candle data on existing chart panes, creating a versatile visualization method that adapts to individual trading preferences and analysis styles.
Why it may be useful
Traditional candlestick charts can sometimes limit traders' perspectives by strictly adhering to market trading hours and sessions. This signal introduces a more flexible approach to understanding price movements by tracking candles across full calendar days, potentially revealing patterns and insights not visible in conventional charting methods.
By offering customization options like start date selection and color coding, the tool empowers traders to personalize their analytical view. The ability to overlay these calendar-based candles on existing charts provides additional context and flexibility in technical analysis strategies.
When to explore it
This candle tracking signal is particularly useful for traders who want to analyze price movements beyond traditional market session boundaries. It can be especially valuable when examining markets that operate across different time zones or when seeking a broader perspective on price action.
Traders should note that the signal is limited to displaying a maximum of 500 candles, which means it's most effective for shorter-term analysis or specific timeframe investigations. The tool is best utilized by traders looking to gain alternative insights into price movements and seeking more nuanced visualization techniques.
Keep exploring
What we’ve verified
Access, alerts and repainting behaviour have not been independently verified for this indicator. Check the creator’s current publication and settings.
General descriptions and classifications are recovered research. Verified details above identify the specific checks we have completed. Check the creator’s current publication for later changes.