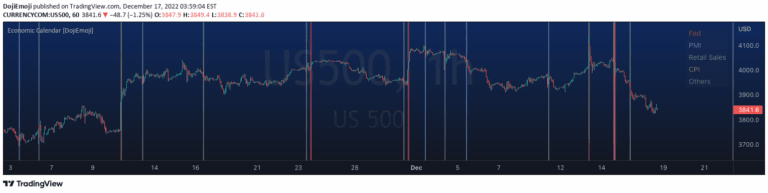
Live Economic Calendar by toodegrees
Live Economic Calendar tracks global financial news events, providing real-time updates on market-moving events across multiple currencies with impact levels and detailed visualizations.
Explore 11,183 indicators. Filter beyond the obvious.
Discover the tools that fit the way you trade.
11,183 tools to explore
Live Economic Calendar tracks global financial news events, providing real-time updates on market-moving events across multiple currencies with impact levels and detailed visualizations.
A trading calendar indicator that displays daily and monthly market sentiment using three different sentiment calculation methods to help traders quickly assess market direction.
A trading tool that tracks major economic events and their potential market impact, helping traders understand pivotal moments in financial markets.
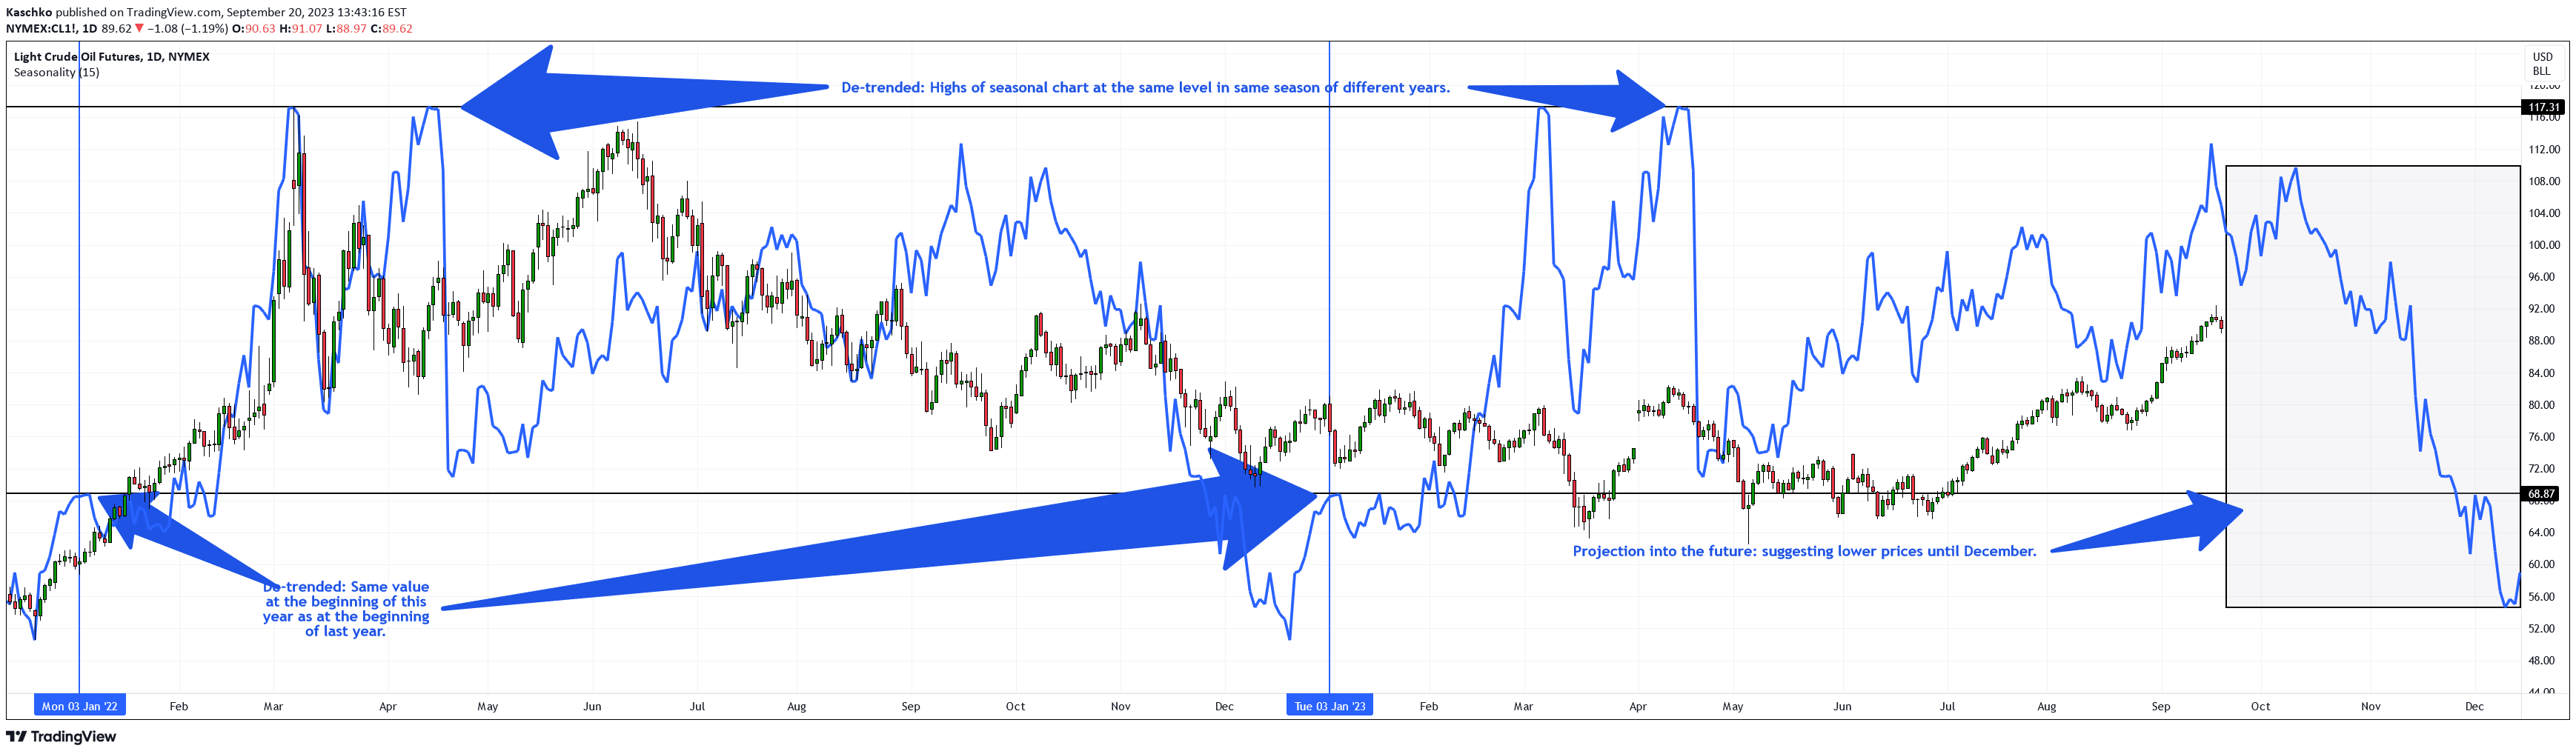
A tool that reveals seasonal price variations by calculating average price changes for specific days across multiple years, helping traders identify recurring market patterns.
A seasonality indicator that analyzes an asset's historical performance across daily, monthly, and quarterly timeframes, revealing patterns of market behavior throughout the year.
A probability cone is a statistical forecast indicator that visualizes potential price distribution using standard or Laplace distributions, helping traders understand potential price movement ranges.
A visualization tool that stacks daily price changes by week, allowing traders to quickly analyze daily and weekly price movement patterns and volatility across different timeframes.
A trading script that automatically draws vertical lines marking economic calendar events using predefined datetime inputs, helping traders visually track significant market events.
A comprehensive dividend tracking tool that helps investors analyze dividend payouts, forecast income, and make strategic investment decisions across various stocks and sectors.
A tool that analyzes market performance across seasonal periods, allowing traders to compare average and raw returns for different yearly seasons in selected hemispheres.
A seasonal trend analysis tool that calculates average price moves across multiple years to create a projected seasonal chart overlay, revealing potential market behavior patterns.
A visual projection tool that helps traders anticipate market structure by plotting forward-looking weekly and daily boxes to frame potential price movement and market profile.
Likes, views, and comments are historical TradingView snapshots. They describe attention, not trading performance.