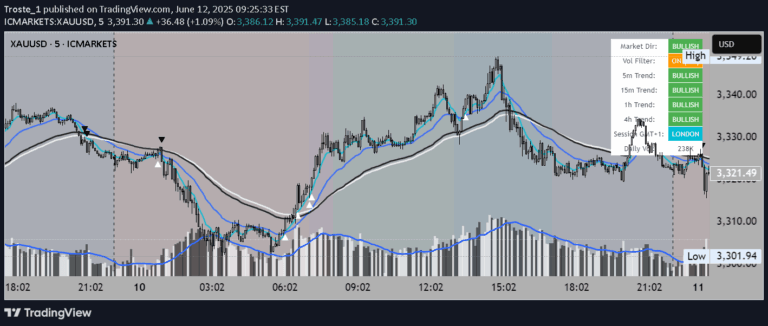
A dynamic trend filter using multiple moving averages to identify market momentum, trend direction, and potential consolidation periods through color-coded histogram signals.
Explore complementary indicator rolesHow it works
The Braid Filter calculates three distinct moving averages: a short-term average close price, a medium-term average open price, and a long-term average close price. It then determines the minimum and maximum of these averages and calculates the difference between the highest and lowest average prices, which is displayed as a histogram.
The indicator incorporates an Average True Range (ATR) filter line to help traders distinguish between trending and consolidating market conditions. By comparing the histogram's position relative to the filter line and analyzing the relationship between average prices, traders can quickly assess market momentum and potential directional shifts.
Why it may be useful
The Braid Filter provides traders with a nuanced view of market dynamics by offering multiple layers of trend analysis beyond simple moving average crossovers. Its color-coded system allows quick visual interpretation of market conditions, helping traders make faster and more informed decisions about potential entry and exit points.
By integrating different timeframe averages and incorporating volatility measurements through ATR, the indicator offers a comprehensive approach to understanding market momentum. Traders can leverage this signal to identify not just trend direction, but also the strength and potential sustainability of price movements.
When to explore it
The Braid Filter is most effective in markets with clear trending characteristics, such as forex, stocks, and futures markets. It performs exceptionally well during periods of sustained price movement, where distinct momentum can be identified and tracked across multiple timeframes.
Traders should pay special attention to the indicator during market transitions, such as when price moves from consolidation to trending conditions. The gray histogram signals provide valuable insights into potential breakout moments, while green and red signals offer clear indications of bullish and bearish momentum.
Keep exploring
What we’ve verified
Access, alerts and repainting behaviour have not been independently verified for this indicator. Check the creator’s current publication and settings.
General descriptions and classifications are recovered research. Verified details above identify the specific checks we have completed. Check the creator’s current publication for later changes.