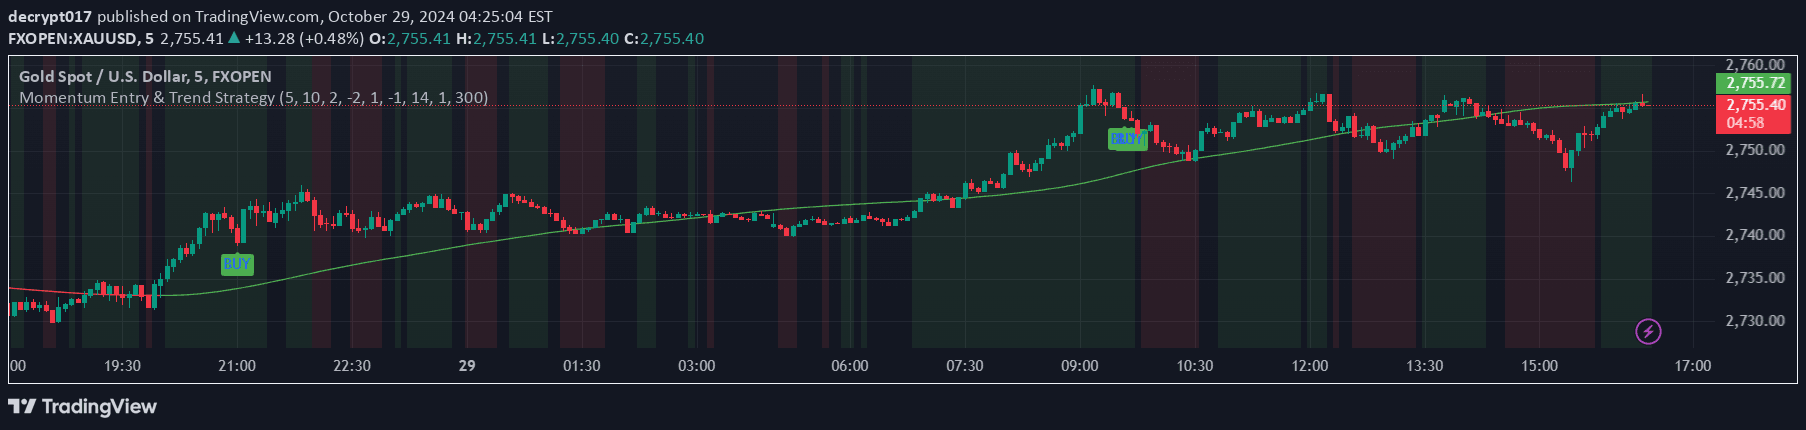
An advanced momentum exhaustion indicator that identifies potential trend reversals by analyzing Linear Regression Heikin Ashi candle patterns and detecting when directional moves lose momentum.
Explore complementary indicator rolesHow it works
The LRHA Trend Shift Detector operates through a sophisticated three-stage detection process that begins with calculating Linear Regression Heikin Ashi candles. This method smooths price action by applying linear regression to Heikin Ashi candles, creating ultra-smooth trend-following candles that effectively filter out market noise.
The indicator then identifies extended directional moves by counting consecutive bullish or bearish candles and monitors momentum exhaustion by comparing recent candle sizes. When the analysis detects significant changes in candle size and direction, it plots red dots above or below candlesticks to signal potential trend reversals or momentum shifts.
Why it may be useful
The LRHA Trend Shift Detector provides traders with a nuanced approach to identifying potential trend changes and momentum exhaustion. By offering a more refined analysis of price movement, it helps traders recognize when strong directional moves are losing steam, potentially allowing for more precise entry and exit decisions.
This indicator is particularly valuable because it combines multiple analytical techniques, including linear regression and Heikin Ashi candle analysis, to create a more robust trend detection mechanism. Its ability to filter out market noise and provide clear visual signals makes it a powerful tool for traders seeking to understand underlying market dynamics and potential trend reversals.
When to explore it
The LRHA Trend Shift Detector is most effective in markets with clear directional movements, such as trending stocks, forex pairs, or commodities. It performs best when used in conjunction with other technical analysis tools, providing additional confirmation of potential trend changes or momentum shifts.
Traders should consider using this indicator during periods of sustained price movement, particularly when looking to identify potential pullback entries or exit points in an existing trend. It is particularly useful for traders who want a more sophisticated approach to trend analysis that goes beyond traditional moving averages or simple momentum indicators.
Keep exploring
What we’ve verified
Access, alerts and repainting behaviour have not been independently verified for this indicator. Check the creator’s current publication and settings.
General descriptions and classifications are recovered research. Verified details above identify the specific checks we have completed. Check the creator’s current publication for later changes.