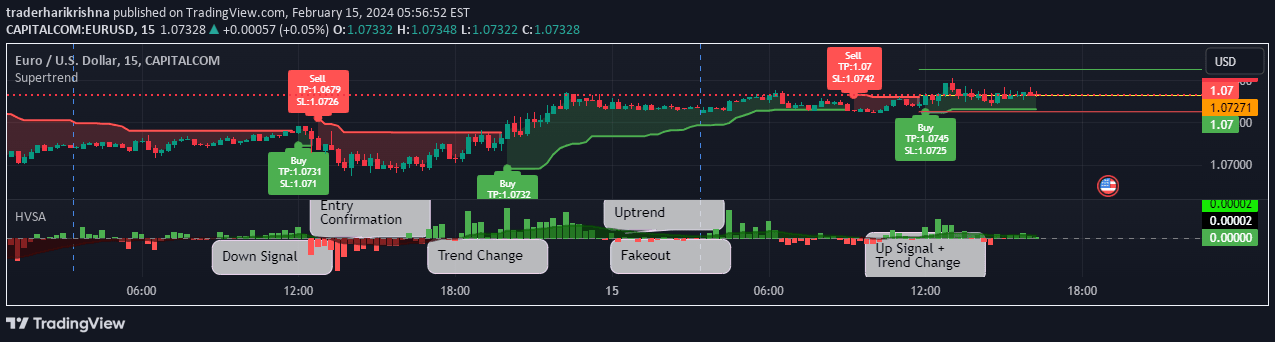
A customizable Ichimoku variant that allows users to modify indicator lines using volume-weighted calculations and additional trend analysis features.
Explore complementary indicator rolesHow it works
The modified Ichimoku indicator offers flexible configuration for line calculations, enabling traders to choose between standard price averaging and volume-weighted methods. Users can customize the Kijun, Tenkan, Senkau Span A, and Senkau Span B lines using different calculation techniques, including standard price averages, volume-based averages, and hybrid methods.
The indicator incorporates the T.R.A.M.A. backline to provide additional trend strength insights. By analyzing line movements and positioning, traders can assess market conditions, with sideways line movement indicating consolidation and directional movement suggesting an active trend phase.
Why it may be useful
This enhanced Ichimoku variant provides traders with a more nuanced and adaptable trend analysis tool compared to traditional approaches. By allowing volume-weighted calculations and multiple line configuration options, the indicator offers greater flexibility in interpreting market dynamics and potential trend movements.
The customization features enable traders to fine-tune the indicator to specific market conditions, asset types, and trading styles. The incorporation of the T.R.A.M.A. backline adds an extra layer of trend strength analysis, helping traders make more informed decisions about market momentum and potential trade opportunities.
When to explore it
The modified Ichimoku indicator is most effective in markets with clear trending characteristics and sufficient trading volume. It performs exceptionally well in forex, cryptocurrency, and liquid stock markets where volume data provides meaningful insights into price movements.
Traders should utilize this indicator during periods of established market trends, using its customizable features to adapt to changing market conditions. It is particularly useful for identifying trend strength, potential reversals, and confirming entry and exit points across different timeframes and trading strategies.
Keep exploring
What we’ve verified
Access, alerts and repainting behaviour have not been independently verified for this indicator. Check the creator’s current publication and settings.
General descriptions and classifications are recovered research. Verified details above identify the specific checks we have completed. Check the creator’s current publication for later changes.