
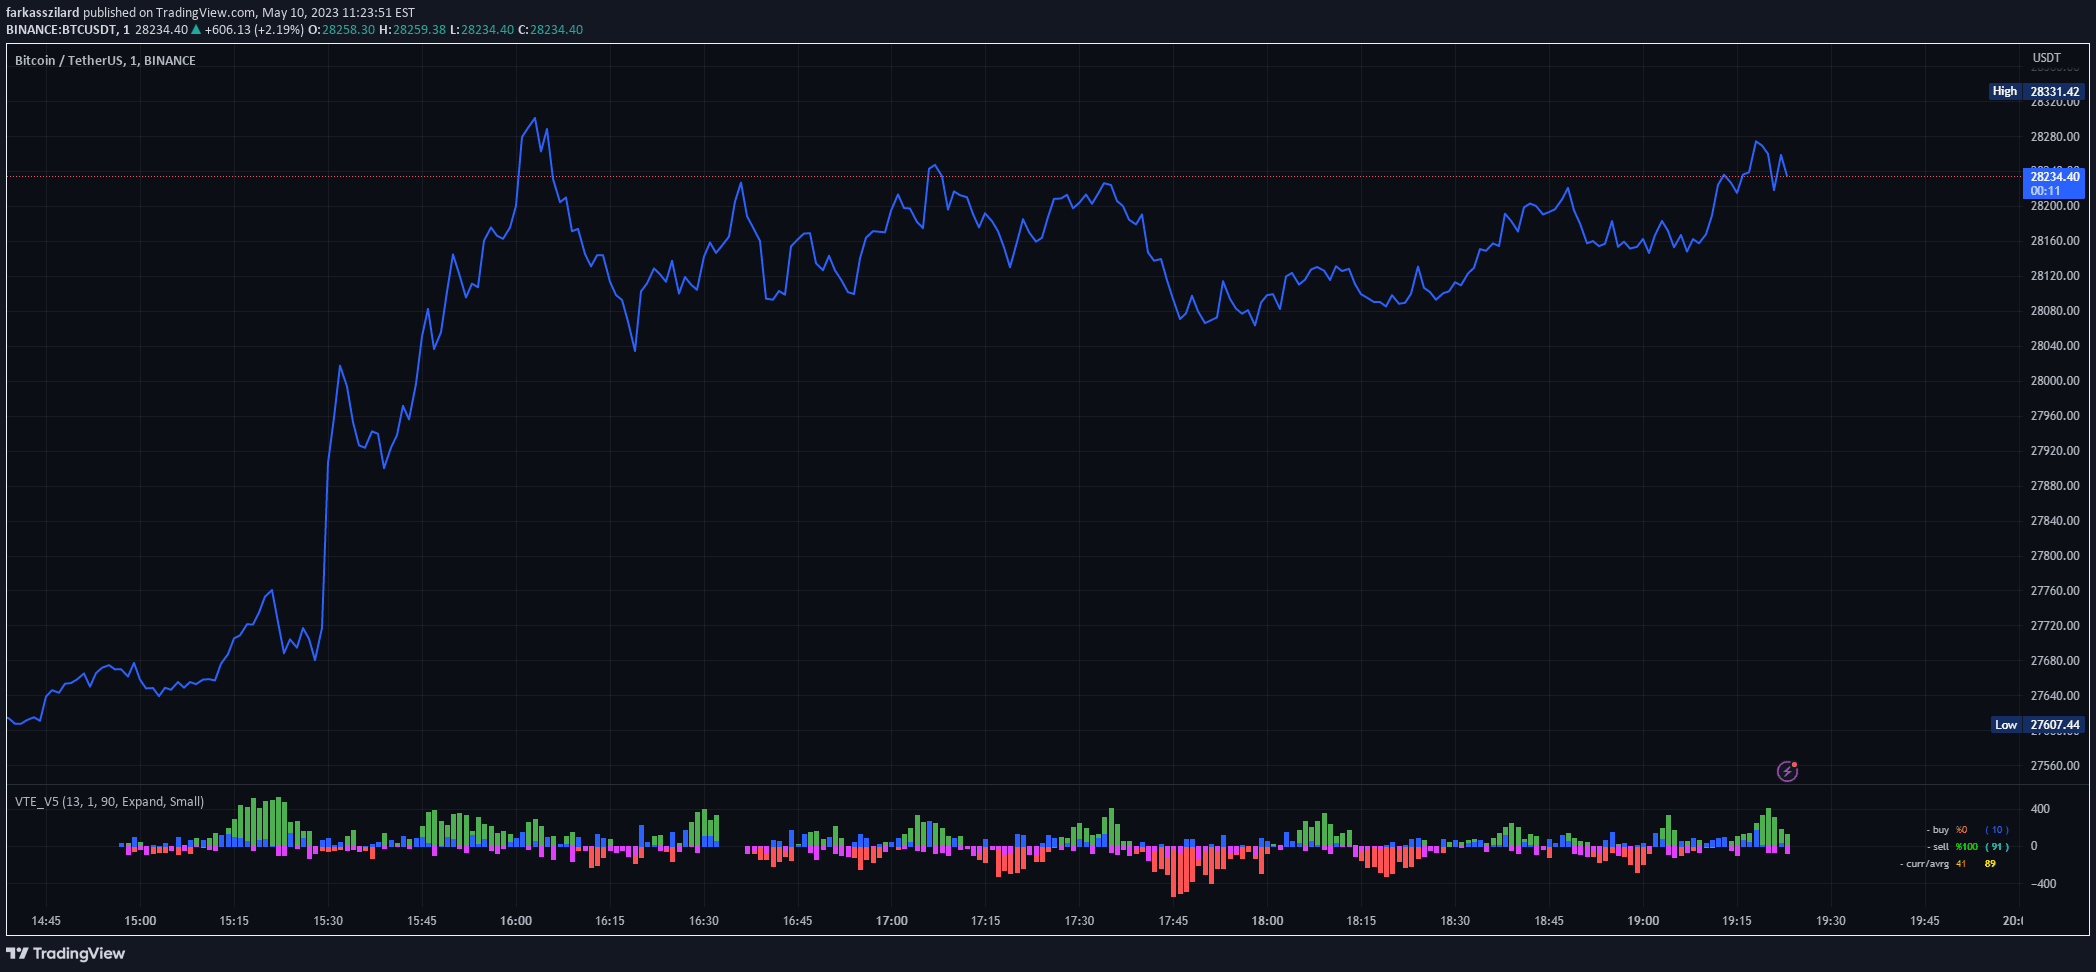
A real-time volume analysis indicator that tracks buying and selling volume percentages and triggers gas signals when volume reaches predefined thresholds.
Explore complementary indicator rolesHow it works
The indicator continuously analyzes volume for a trading asset using open, high, low, and close prices. It calculates the average volume over a selected period and determines the percentage of buying and selling volume in real-time.
Based on the DGT Bull vs Bear Power indicator, this signal monitors volume dynamics by tracking the ongoing balance between buying and selling pressure. When either buying or selling volume percentage reaches a predetermined threshold, a gas signal is activated, providing traders with immediate insights into market momentum.
Why it may be useful
This volume indicator helps traders understand the underlying market dynamics by providing continuous insights into buying and selling pressure. By offering real-time volume percentage information, traders can quickly assess the strength and direction of market movements.
The gas signal mechanism allows traders to identify potential market shifts and momentum changes before they become fully apparent in price action. This early warning system can help traders make more informed decisions about market entry and exit points.
When to explore it
The indicator is most effective in markets with clear volume trends and significant price movements. It works best for traders who want to monitor intraday volume dynamics and quickly identify potential market shifts. Active traders can benefit from its real-time analysis, particularly in volatile or trending markets.
Scalpers and day traders will find this indicator especially useful, as it provides immediate insights into market sentiment and volume-driven momentum. Traders should combine this signal with other technical indicators to confirm potential trading opportunities and reduce false signals.
Keep exploring
What we’ve verified
Access, alerts and repainting behaviour have not been independently verified for this indicator. Check the creator’s current publication and settings.
General descriptions and classifications are recovered research. Verified details above identify the specific checks we have completed. Check the creator’s current publication for later changes.



