Realtime 5D Profile [LucF]
A real-time trading profile indicator that visualizes volume, price, time, activity, and age across different market levels, providing dynamic insights into trading activity.
Explore 11,183 indicators. Filter beyond the obvious.
Discover the tools that fit the way you trade.
11,183 tools to explore
A real-time trading profile indicator that visualizes volume, price, time, activity, and age across different market levels, providing dynamic insights into trading activity.
A real-time volume delta and tick indicator providing detailed insights into market dynamics by analyzing live trading updates, focusing on price action and volume information at small timeframes.
A comprehensive trading tool combining order blocks and Fibonacci retracements to identify potential market entry and exit points based on significant order zones and mathematical support/resistance levels.
A comprehensive toolkit for detecting price and indicator divergences, identifying potential trend reversals and continuations across different market conditions and trading strategies.
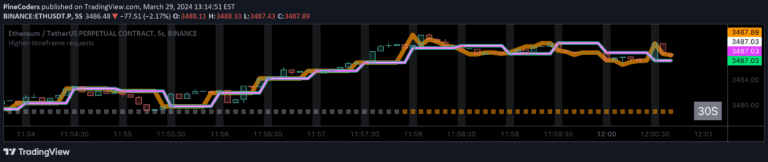
A comprehensive guide to accessing higher-timeframe data using request.security() function while preventing repainting, offering multiple non-repainting techniques for more reliable trading signals.
An advanced technical analysis script exploring the security() function in Pine Script, focusing on preventing repainting and understanding multi-timeframe data retrieval techniques.
A comprehensive trading script that identifies multiple types of divergences across different indicators, providing real-time and historical divergence analysis with extensive customization options.
A dynamic grid display showing real-time currency pair exchange rates and daily percentage changes across multiple currencies, enabling comprehensive forex market monitoring.
A multi-timeframe market sentiment dashboard using EMA-based analysis to provide quick visual insights into market trends across different time periods.
An indicator that plots horizontal lines representing the daily high and low levels of On Balance Volume (OBV), providing real-time updates of volume-based trading dynamics.
A real-time daily price indicator that plots horizontal and vertical lines to highlight key price levels and daily candle midpoints with customizable visual settings.
A real-time volume analysis indicator that tracks buying and selling volume percentages and triggers gas signals when volume reaches predefined thresholds.
Likes, views, and comments are historical TradingView snapshots. They describe attention, not trading performance.