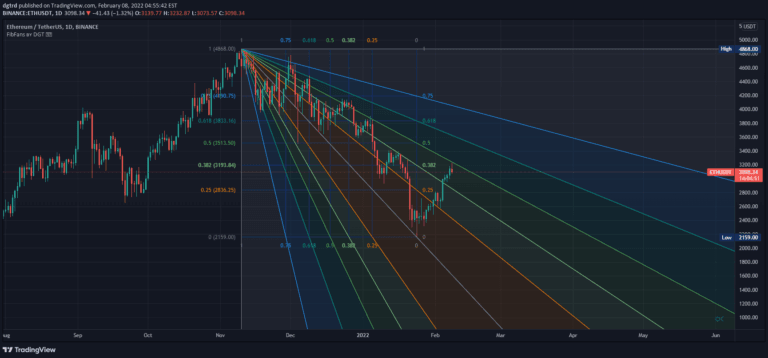
Auto Fib Speed Resistance Fans by DGT
Fibonacci Speed and Resistance Fan is an analytical tool that identifies potential support and resistance levels by drawing lines based on Fibonacci percentages to predict trend changes and market movements.
Explore 11,183 indicators. Filter beyond the obvious.
Discover the tools that fit the way you trade.
11,183 tools to explore
Fibonacci Speed and Resistance Fan is an analytical tool that identifies potential support and resistance levels by drawing lines based on Fibonacci percentages to predict trend changes and market movements.
A momentum-based trading signal that measures price changes over time, using speed and acceleration principles to identify potential trend directions and trading setups.
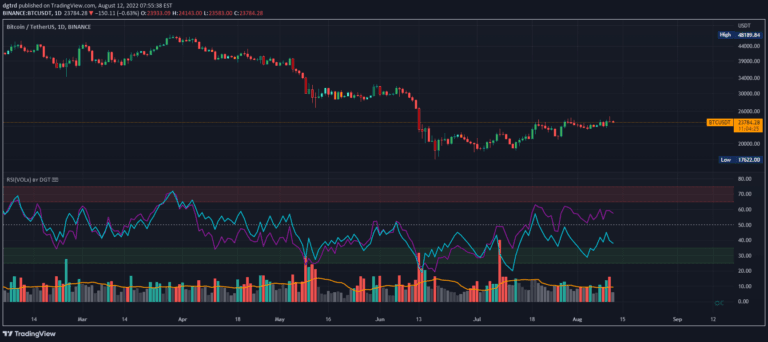
RSI is a momentum oscillator measuring price movement speed, analyzing price changes and volume to identify potential trend reversals and market conditions.
A sophisticated momentum oscillator using windowed sinc low pass filter to generate smoother, more accurate rate of change analysis with advanced visualization features.
A custom Donchian channel-based zig-zag indicator that tracks price extremities, offering unique insights into market movements and potential support/resistance levels.
A higher timeframe indicator that identifies and visualizes fair value gaps in price movement, highlighting potential trading opportunities through color-coded background and candle representations.
A dynamic trend analysis tool that measures market momentum by tracking wave sizes, speed, and trend direction using advanced moving average techniques.
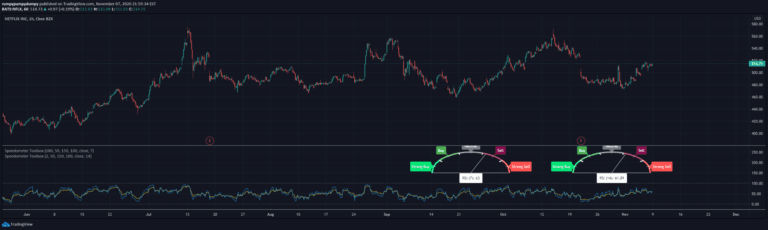
Custom metric speedometers provide specialized visualization techniques for tracking and representing performance indicators through graphical gauge-like representations.
A comprehensive technical analysis tool combining MACD, RSI, and Bollinger Bands to identify market trends, momentum, and potential reversals through multiple indicator perspectives.
A hybrid trading indicator combining Fibonacci retracement levels and RSI to identify potential market reversals and trading opportunities based on support, resistance, and momentum signals.
A dynamic volume analysis tool that tracks volume flow, measures trading activity intensity, and provides real-time insights into buyer and seller dominance across different timeframes.
An adaptive momentum oscillator that measures relative price momentum using maximum delta, featuring a histogram and smoothed trend direction indicator.
Likes, views, and comments are historical TradingView snapshots. They describe attention, not trading performance.