YOUR INDICATOR RESEARCH STARTS HERE

Find the right indicator.
Understand what it does.

Explore 11,183 indicators. Filter beyond the obvious.
Discover the tools that fit the way you trade.

THE INDICATOR LIBRARY

Results for “lookback”

11,183 tools to explore

656 indicators matching your filters
Save search
VolumeSignalLevels

Liquidity Swings [LuxAlgo]

by LuxAlgo

A liquidity indicator that highlights swing areas with trading activity, tracking price revisits, accumulated volume, and potential support/resistance zones using customizable filtering.

Main price chart · unverifiedDay Trading · Swing Trading
Explore
17.9Klikes731.9Kviews131comments
Save
LevelsSignal

Order Blocks & Breaker Blocks [LuxAlgo]

by LuxAlgo

Order Blocks & Breaker Blocks indicator identifies key price zones where significant trading activity occurred, highlighting potential future trading opportunities based on market structure.

Main price chart · unverifiedScalping · Day Trading
Explore
16.5Klikes539.3Kviews109comments
Save
TrendVolatilityEditor’s pick

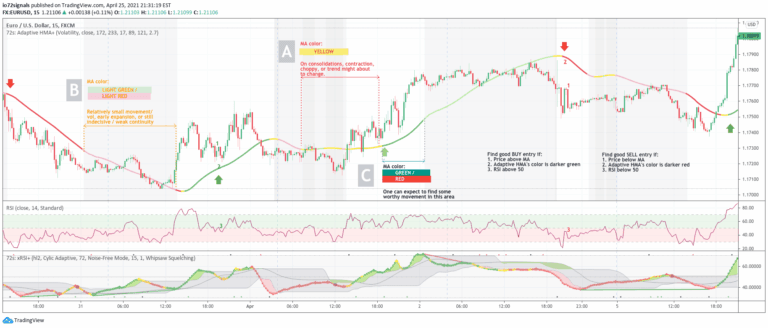
72s: Adaptive Hull Moving Average+

by io72signals

An adaptive Hull Moving Average that dynamically adjusts its period based on volume and volatility, providing clearer trend signals and market condition insights for traders.

Main price chart · unverifiedDay Trading · Swing Trading
Explore
8.2Klikes154.6Kviews137comments
Save
LevelsSignalTrend

Ghost Tangent Crossings [ChartPrime]

by ChartPrime

Ghost Tangent Crossings is an innovative pivot point indicator that visualizes market movements using ellipses, dynamically tracking zig-zag patterns and potential price breakouts.

Main price chart · unverifiedScalping · Day Trading
Explore
7.3Klikes115.5Kviews73comments
Save
SignalTrend

SMT Divergences [LuxAlgo]

by LuxAlgo

An indicator that identifies divergences between swing points of a chart symbol and two external tickers, providing statistical insights into price behavior correlation.

Separate pane · unverifiedDay Trading · Swing Trading
Explore
5.9Klikes144.4Kviews44comments
Save
VolumeSignalLevels

Swing Volume Profiles [LuxAlgo]

by LuxAlgo

A volume profile indicator that reveals trading activity at price levels, highlighting key support and resistance zones through volume analysis and detecting market liquidity dynamics.

Main price chart · unverifiedScalping · Day Trading
Explore
5.6Klikes170.3Kviews35comments
Save
LevelsSignalTrend

Trend Lines [LuxAlgo]

by LuxAlgo

A dynamic trendline indicator that detects and highlights support/resistance lines in real-time, with customizable filters for angle, length, and break detection across different market conditions.

Main price chart · unverifiedScalping · Day Trading
Explore
4.9Klikes131.7Kviews13comments
Save
VolumeTrendEditor’s pick

Liquidity Levels [LuxAlgo]

by LuxAlgo

Peak Activity Levels indicator identifies support and resistance zones using volume peaks, displaying price levels where significant trading activity occurs and highlighting potential market turning points.

Main price chart · unverifiedDay Trading · Swing Trading
Explore
4.8Klikes280.7Kviews26comments
Save
LevelsMomentumOscillator

Auto Fibo on Indicators

by KivancOzbilgic

An advanced Fibonacci Retracement tool that automatically draws levels on various technical indicators, helping traders identify potential support and resistance zones.

Separate pane · unverifiedScalping · Day Trading
Explore
3.9Klikes78.6Kviews42comments
Save
VolumeTrendEditor’s pick

Rolling VWAP

by TradingView

Rolling Volume-Weighted Average Price (RVWAP) is a dynamic indicator that calculates a moving average price weighted by volume across a flexible time window, adapting to different chart timeframes.

Main price chart · unverifiedDay Trading · Swing Trading
Explore
3.9Klikes124.1Kviews74comments
Save
LevelsSignalVolume

Open Liquidity Heatmap [BigBeluga]

by BigBeluga

An advanced liquidity heatmap that accumulates and tracks resting liquidity levels over time, revealing potential high-impact price zones by aggregating volume across multiple price levels.

Main price chart · unverifiedScalping · Day Trading
Explore
3.9Klikes79.1Kviews28comments
Save

Likes, views, and comments are historical TradingView snapshots. They describe attention, not trading performance.

START WITH A QUESTION

A little less searching.
A lot more understanding.

Tell DeepAlpha what you need. Get an explanation, a shortlist,
and a direct path to the indicators behind it.

Ask DeepAlpha