YOUR INDICATOR RESEARCH STARTS HERE

Find the right indicator.
Understand what it does.

Explore 11,183 indicators. Filter beyond the obvious.
Discover the tools that fit the way you trade.

THE INDICATOR LIBRARY

Results for “retracements”

11,183 tools to explore

119 indicators matching your filters
Save search
TrendMomentumEditor’s pick

Elliott Wave [LuxAlgo]

by LuxAlgo

Elliott Wave indicator automatically detects impulse and corrective wave patterns in price movements, helping traders identify potential trend directions and market phases.

Main price chart · unverifiedDay Trading · Swing Trading
Explore
11.4Klikes476Kviews157comments
Save
LevelsSignalTrend

DTFX Algo Zones [LuxAlgo]

by LuxAlgo

Auto-generated Fibonacci Retracements that identify market structure shifts and potential support/resistance zones based on technical breaks and price action dynamics.

Main price chart · unverifiedScalping · Day Trading
Explore
9.4Klikes142Kviews67comments
Save
LevelsTrend

Fibonacci Trend [ChartPrime]

by ChartPrime

A dynamic trading indicator combining supertrend analysis with Fibonacci levels to identify market direction, support/resistance zones, and potential entry points.

Main price chart · unverifiedScalping · Day Trading
Explore
5.9Klikes93.3Kviews20comments
Save
LevelsTrendVolume

Range Analysis - By Leviathan

by LeviathanCapital

An advanced trading tool that analyzes price ranges by automatically drawing range levels, volume profiles, and various analytical tools to help traders understand market structure and potential price movements.

Main price chart · unverifiedScalping · Day Trading
Explore
4.7Klikes89.1Kviews41comments
Save
LevelsSignalVolatility

ICT Killzones [LuxAlgo]

by LuxAlgo

A trading tool highlighting specific time-based market zones and Fibonacci retracements to identify optimal entry points across different forex trading sessions.

Main price chart · unverifiedScalping · Day Trading
Explore
4.5Klikes174.4Kviews31comments
Save
LevelsSignalTrend

Order Blocks W/ Realtime Fibs [QuantVue]

by QuantVue

A comprehensive trading tool combining order blocks and Fibonacci retracements to identify potential market entry and exit points based on significant order zones and mathematical support/resistance levels.

Main price chart · unverifiedScalping · Day Trading
Explore
3.7Klikes122.4Kviews29comments
Save
LevelsSignalTrend

Liquidity Concepts [BigBeluga]

by BigBeluga

Liquidity Concepts indicator identifies potential stop-loss zones and market structure using pivot points to help traders detect liquidity grabs and stop-loss hunts.

Main price chart · unverifiedScalping · Day Trading
Explore
2.4Klikes85.3Kviews26comments
Save
TrendMomentumEditor’s pick

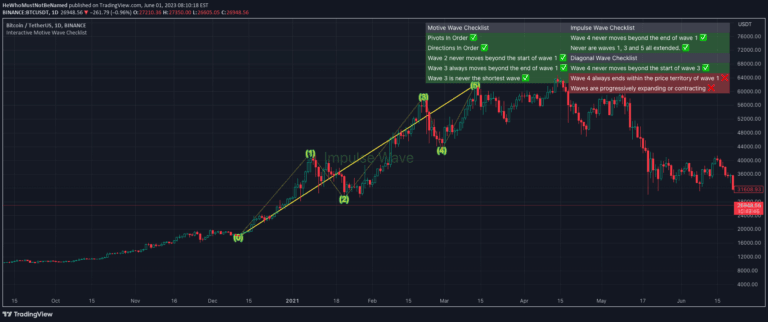
Interactive Motive Wave Checklist

by Trendoscope

Elliott Wave analysis is a technical trading method that identifies market trends by examining price wave patterns, helping traders predict potential market movements and trend reversals.

Main price chart · unverifiedDay Trading · Swing Trading
Explore
2.3Klikes55.2Kviews25comments
Save

Likes, views, and comments are historical TradingView snapshots. They describe attention, not trading performance.

START WITH A QUESTION

A little less searching.
A lot more understanding.

Tell DeepAlpha what you need. Get an explanation, a shortlist,
and a direct path to the indicators behind it.

Ask DeepAlpha