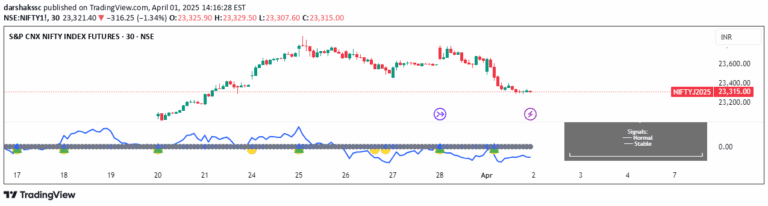
A volume-based trading signal that combines Chaikin Money Flow and Klinger Volume Oscillator to identify market conditions where volume and price alignment suggest potential trading opportunities.
Explore complementary indicator rolesHow it works
The Volume Flow Confluence Indicator integrates two sophisticated volume analysis methods: Chaikin Money Flow (CMF) and Klinger Volume Oscillator (KVO). It calculates money flow volume by analyzing price location within the trading range and evaluates volume force in relation to price movement.
The indicator generates signals by comparing CMF and KVO values, creating a histogram that appears only when both indicators align. Green bars indicate positive CMF and KVO above its signal line, while red bars show negative CMF and KVO below its signal line, providing a nuanced view of volume-driven market dynamics.
Why it may be useful
The Volume Flow Confluence Indicator offers traders a sophisticated approach to understanding market momentum through volume analysis. By combining two complementary volume indicators, it provides a more robust and reliable signal than single-indicator approaches, helping traders identify potential trend confirmations and reversals.
This method reduces false signals by requiring agreement between different volume metrics, offering a more disciplined and comprehensive view of market conditions. Traders can use this approach to enhance their decision-making process and gain deeper insights into the underlying strength of price movements.
When to explore it
The Volume Flow Confluence Indicator is most effective in markets with clear trending characteristics and substantial trading volume. It works best on timeframes of 1 hour or longer, providing more reliable signals for day and swing traders seeking to confirm trend strength and potential entry or exit points.
Traders should use this indicator in conjunction with other technical analysis tools, as it is not a standalone predictive mechanism. It is particularly useful during periods of market transition, helping identify potential shifts in momentum and providing additional context to price action.
Keep exploring
What we’ve verified
Access, alerts and repainting behaviour have not been independently verified for this indicator. Check the creator’s current publication and settings.
General descriptions and classifications are recovered research. Verified details above identify the specific checks we have completed. Check the creator’s current publication for later changes.