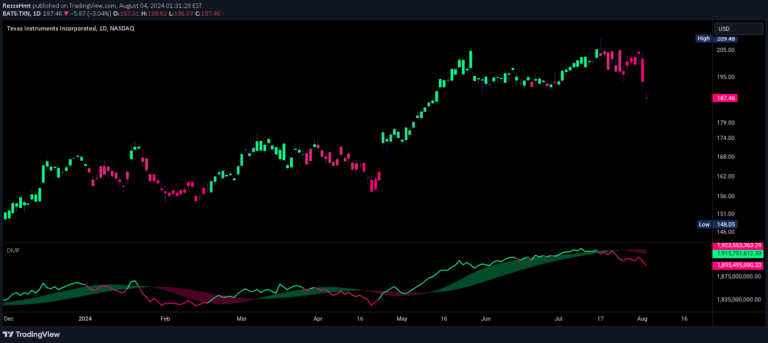
Market Push Meter analyzes volume pressure through unique volume analysis, revealing the battle between buyers and sellers by measuring directional volume and price action imbalances.
Explore complementary indicator rolesHow it works
The Market Push Meter calculates volume pressure by separating up-volume and down-volume, creating normalized pressure columns that indicate buying or selling strength. Green columns represent net buying pressure, while red columns show net selling pressure.
The indicator tracks dynamic marker lines at high and low boundaries, identifies peak formations with triangular markers, and uses color intensity to visualize pressure magnitude
Why it may be useful
Traders can gain deep insights into market dynamics by understanding volume imbalances and pressure shifts. The indicator helps identify trend changes, potential reversals, and market exhaustion points by revealing which market participants are exerting more influence.
By visualizing volume pressure beyond traditional volume indicators, traders can make more informed decisions about market sentiment and potential price movements
When to explore it
The Market Push Meter works best in trending and volatile markets where volume dynamics are significant. It is most effective when used alongside price action analysis and other confirmation indicators.
Traders should pay special attention to zero-line crosses, boundary breaks, peak formations, and extreme pressure readings. The indicator is particularly useful for identifying potential trend reversals and assessing the strength of current market momentum
Keep exploring
What we’ve verified
Access, alerts and repainting behaviour have not been independently verified for this indicator. Check the creator’s current publication and settings.
General descriptions and classifications are recovered research. Verified details above identify the specific checks we have completed. Check the creator’s current publication for later changes.