
YOUR INDICATOR RESEARCH STARTS HERE

Find the right indicator.
Understand what it does.

Explore 11,183 indicators. Filter beyond the obvious.
Discover the tools that fit the way you trade.

THE INDICATOR LIBRARY

Results for “highsandlows”

11,183 tools to explore

12 indicators matching your filters
Save search
VolumeTrendEditor’s pick

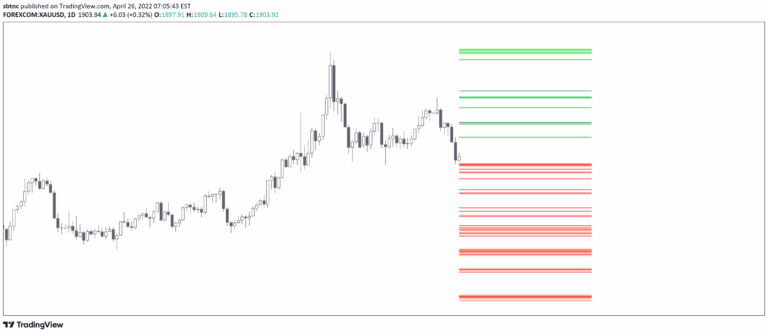
HTF Liquidity Levels

by sbtnc

A trading indicator that identifies untapped liquidity levels across different timeframes, helping traders understand potential price movement magnets and liquidity pools in the market.

Main price chart · unverifiedDay Trading · Swing Trading
Explore
4Klikes177.3Kviews83comments
Save
LevelsSignal

HTF Liquidity Dashboard [TFO]

by tradeforopp

A multi-symbol scanner that tracks price movements against previous day, week, and month highs and lows, providing visual and alert-based tracking of key market levels.

Main price chart · unverifiedScalping · Day Trading
Explore
2.7Klikes65.9Kviews26comments
Save
MomentumEditor’s pick

MESA Stochastic Multi Length

by veryfid

John Ehler's MESA Stochastic is a unique indicator using super smoothing to analyze market waves, help identify market tops and bottoms, and generate trading signals.

Separate pane · unverifiedSwing Trading
Explore
1.2Klikes36.6Kviews42comments
Save
SignalTrend

3 Day Lookback [TFO]

by tradeforopp

A compact 3-day lookback indicator that visually tracks price movement relative to previous day's high and low ranges using color-coded signals.

Main price chart · unverifiedScalping · Day Trading
Explore
642likes9.4Kviews5comments
Save
MomentumOscillatorTrend

Price Exhaustion Indicator

by profitprotrading

A comprehensive trend exhaustion indicator combining ATR, MACD, and Stochastic Oscillator to identify potential market reversals and trend weakening points.

Separate pane · unverifiedDay Trading · Swing Trading
Explore
625likes11.4Kviews3comments
Save
LevelsSignal

Custom Previous High/Low + Breakout Alerts

by Ufonose

A technical indicator that tracks the previous high and low of a selected timeframe, providing breakout alerts when price crosses these key levels, helping traders identify potential entry and exit points.

Main price chart · unverifiedScalping · Day Trading
Explore
176likes2.2Kviews2comments
Save
MomentumSignalVolatility

MTF Stationary Extreme Indicator

by LeafAlgo

A multi-timeframe indicator analyzing extreme price movements to identify potential overbought and oversold market conditions across different timeframe perspectives.

Separate pane · unverifiedScalping · Day Trading
Explore
47likes2.4Kviews1comments
Save
LevelsSignal

Essa - Multi-Timeframe Levels

by Essa02

A multi-timeframe indicator that plots yearly, quarterly, and monthly price levels, providing traders with key support and resistance zones and automated alerts.

Main price chart · unverifiedScalping · Day Trading
Explore
44likes789views0comments
Save
LevelsTrend

Essa - Yearly High, Low & Mid

by Essa02

A yearly price level indicator that tracks annual highs, lows, and midpoints. Helps traders visualize key price levels across multiple years for strategic technical analysis.

Main price chart · unverifiedSwing Trading
Explore
14likes498views0comments
Save
LevelsSignal

Highs&Lows by Hour

by AntonioCondito

A TradingView indicator that analyzes and highlights the most frequent hours for daily price highs and lows, helping traders identify key market timing patterns.

Separate pane · unverifiedScalping · Day Trading
Explore
11likes524views0comments
Save

Likes, views, and comments are historical TradingView snapshots. They describe attention, not trading performance.

START WITH A QUESTION

A little less searching.
A lot more understanding.

Tell DeepAlpha what you need. Get an explanation, a shortlist,
and a direct path to the indicators behind it.

Ask DeepAlpha