YOUR INDICATOR RESEARCH STARTS HERE

Find the right indicator.
Understand what it does.

Explore 11,183 indicators. Filter beyond the obvious.
Discover the tools that fit the way you trade.

THE INDICATOR LIBRARY

Results for “HIGH-LOW”

11,183 tools to explore

133 indicators matching your filters
Save search
VolumeTrendEditor’s pick

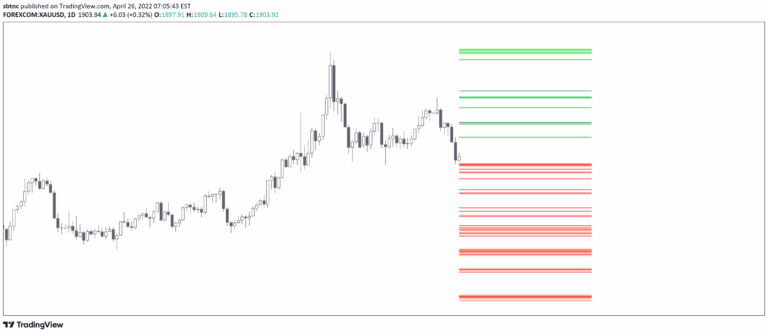
HTF Liquidity Levels

by sbtnc

A trading indicator that identifies untapped liquidity levels across different timeframes, helping traders understand potential price movement magnets and liquidity pools in the market.

Main price chart · unverifiedDay Trading · Swing Trading
Explore
4Klikes177.3Kviews83comments
Save
TrendSignalChannels

High-Low Cloud Trend [ChartPrime]

by ChartPrime

A dynamic cloud trend indicator that combines trend following and mean reversion, visualizing market conditions through adaptive high and low bands with color-coded insights.

Main price chart · unverifiedScalping · Day Trading
Explore
2.2Klikes35.4Kviews7comments
Save
TrendVolatilityEditor’s pick

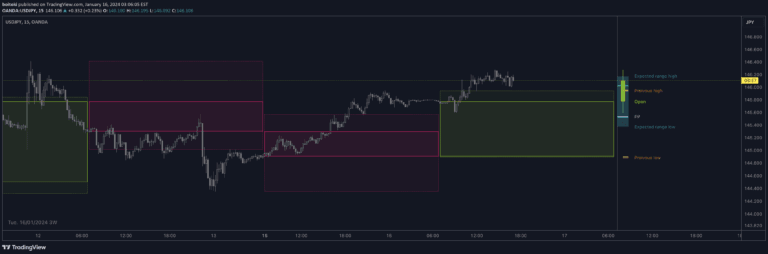
HTF Candles & Pivots

by boitoki

A multi-timeframe candle visualization tool that allows flexible display of historical price data with pivot point calculations and customizable viewing options.

Main price chart · unverifiedDay Trading · Swing Trading
Explore
1.9Klikes82.2Kviews88comments
Save
SignalVolatility

DTR & ATR

by ripster47

ATR and DTR are technical indicators that measure price volatility and daily trading range, helping traders assess market conditions and manage risk effectively.

Separate pane · unverifiedScalping · Day Trading
Explore
1.3Klikes17.3Kviews9comments
Save
TrendVolatilityEditor’s pick

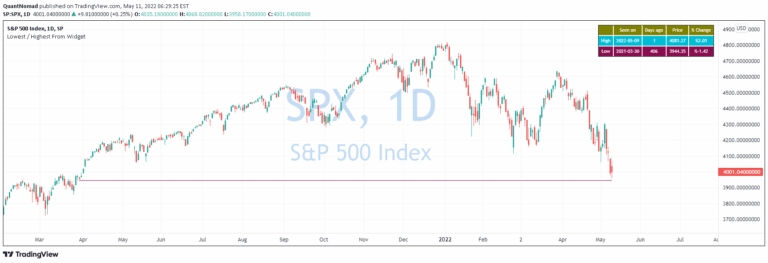
Lowest / Highest From Widget

by QuantNomad

A widget that identifies the most recent day when price was higher or lower than the current value, visualizing historical price comparisons through lines and informative tables.

Main price chart · unverifiedDay Trading · Swing Trading
Explore
815likes45.8Kviews12comments
Save
LevelsSignal

Pi - Intraday High-Low Predictor

by Keanu_ritz

A trading indicator that predicts potential price ranges using Pi (3.14) and the first 5-minute candle's range, helping traders anticipate possible day highs and lows.

Main price chart · unverifiedScalping · Day Trading
Explore
620likes15.6Kviews5comments
Save

Likes, views, and comments are historical TradingView snapshots. They describe attention, not trading performance.

START WITH A QUESTION

A little less searching.
A lot more understanding.

Tell DeepAlpha what you need. Get an explanation, a shortlist,
and a direct path to the indicators behind it.

Ask DeepAlpha