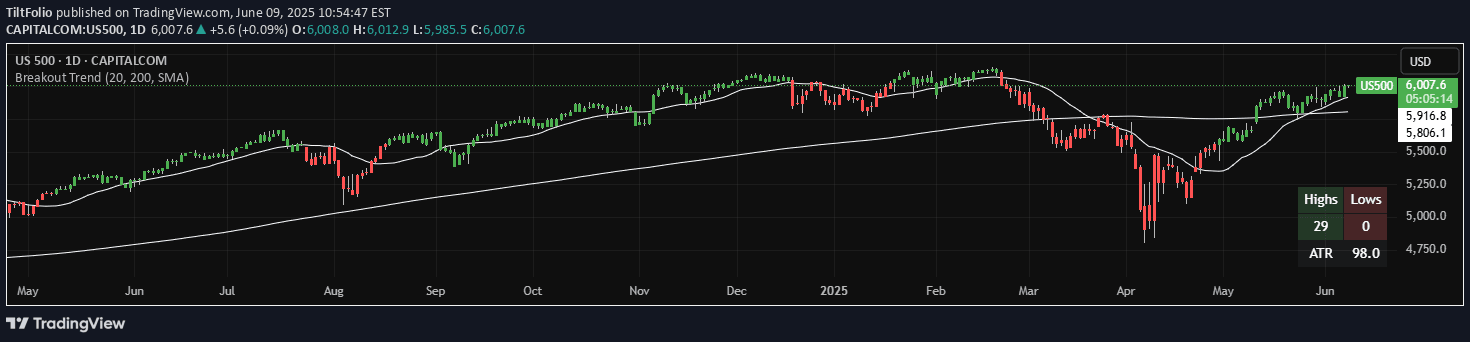
A dynamic cloud trend indicator that combines trend following and mean reversion, visualizing market conditions through adaptive high and low bands with color-coded insights.
Explore complementary indicator rolesHow it works
The High-Low Cloud Trend indicator generates dynamic cloud bands by calculating high and low values from user-defined lookback periods. It creates two sets of bands: a primary band based on a longer lookback period and a secondary band using a shorter period to capture potential mean reversion points.
The indicator visually represents market trends through color-coded bands, with the cloud filling serving as a visual guide for trend strength and potential reversal zones. By dynamically adjusting these bands, the indicator provides traders with a responsive tool that can quickly adapt to changing market conditions and highlight key price movement characteristics.
Why it may be useful
The High-Low Cloud Trend indicator offers traders a comprehensive visual representation of market dynamics, bridging the gap between trend following and mean reversion strategies. Its unique approach allows traders to quickly assess market conditions, identify potential entry and exit points, and understand the underlying price movement trends with greater clarity.
By combining multiple analytical techniques into a single, intuitive visualization, the indicator helps traders make more informed decisions. The color-coded bands and flexible display options provide quick insights into market momentum, potential reversals, and trend strength, making complex market analysis more accessible and actionable.
When to explore it
The High-Low Cloud Trend indicator is most effective in markets with clear trending or range-bound characteristics, where price movements show discernible patterns and mean reversion tendencies. It works particularly well in liquid markets with sufficient price volatility, such as major stock indices, forex pairs, and actively traded commodities.
Traders can leverage this indicator during periods of market transition, using it to confirm trend changes, identify breakout opportunities, and manage risk by observing price interactions with the dynamic cloud bands. Its versatility makes it suitable for various trading styles, from short-term scalping to longer-term swing trading strategies.
Keep exploring
What we’ve verified
Access, alerts and repainting behaviour have not been independently verified for this indicator. Check the creator’s current publication and settings.
General descriptions and classifications are recovered research. Verified details above identify the specific checks we have completed. Check the creator’s current publication for later changes.