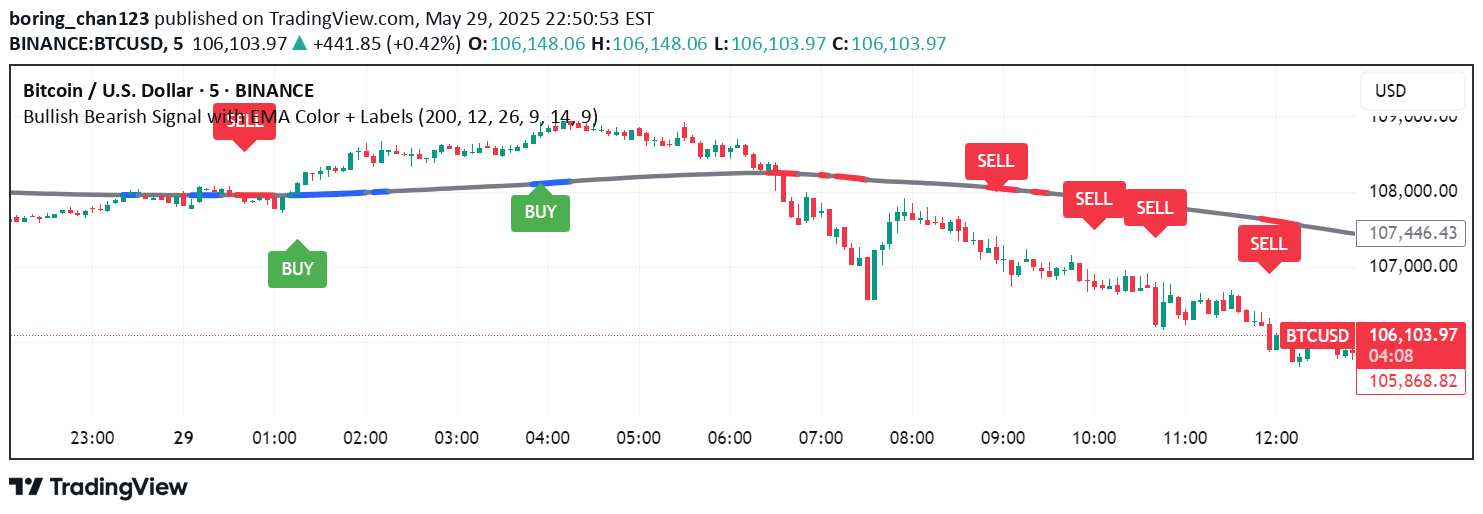
A Break of Structure (BOS) indicator using moving averages to identify early trend changes and potential trading opportunities, focusing on detecting swing highs and lows.
Explore complementary indicator rolesHow it works
The BOS indicator uses moving averages like EMA, RMA, or HMA to detect early trend changes by identifying swing highs and lows. It tracks the highest and lowest values of the selected moving average to mark potential trend reversals, drawing lines to connect these points.
Instead of using traditional pivot point methods, this indicator focuses on MA crossovers and price interactions with the moving average. When price reaches a significant high or low point relative to the moving average, the indicator marks it as a Break of Structure (BOS) point, providing visual cues for potential trading opportunities.
Why it may be useful
This indicator offers traders an alternative method to identify trend changes earlier than traditional pivot point techniques. By using moving averages and tracking their crossovers, traders can potentially catch trend beginnings more quickly, which could lead to more profitable entry points.
The flexibility of choosing different moving average types allows traders to customize the indicator to their specific trading style and market conditions. Its ability to work across different symbols and market environments makes it a versatile tool for traders seeking to improve their trend identification and trade timing.
When to explore it
The BOS indicator is most effective in high volatility markets where clear trend movements are more prevalent. It performs particularly well in trending market conditions across various financial instruments, making it especially useful for traders looking to add positions during emerging trends.
Traders should be cautious about using this indicator in low volatility markets, where trend signals might be less reliable. It is best applied on timeframes that match the trader's trading style, with particular effectiveness for day trading and swing trading strategies that aim to capture multi-day price movements.
Keep exploring
What we’ve verified
Access, alerts and repainting behaviour have not been independently verified for this indicator. Check the creator’s current publication and settings.
General descriptions and classifications are recovered research. Verified details above identify the specific checks we have completed. Check the creator’s current publication for later changes.