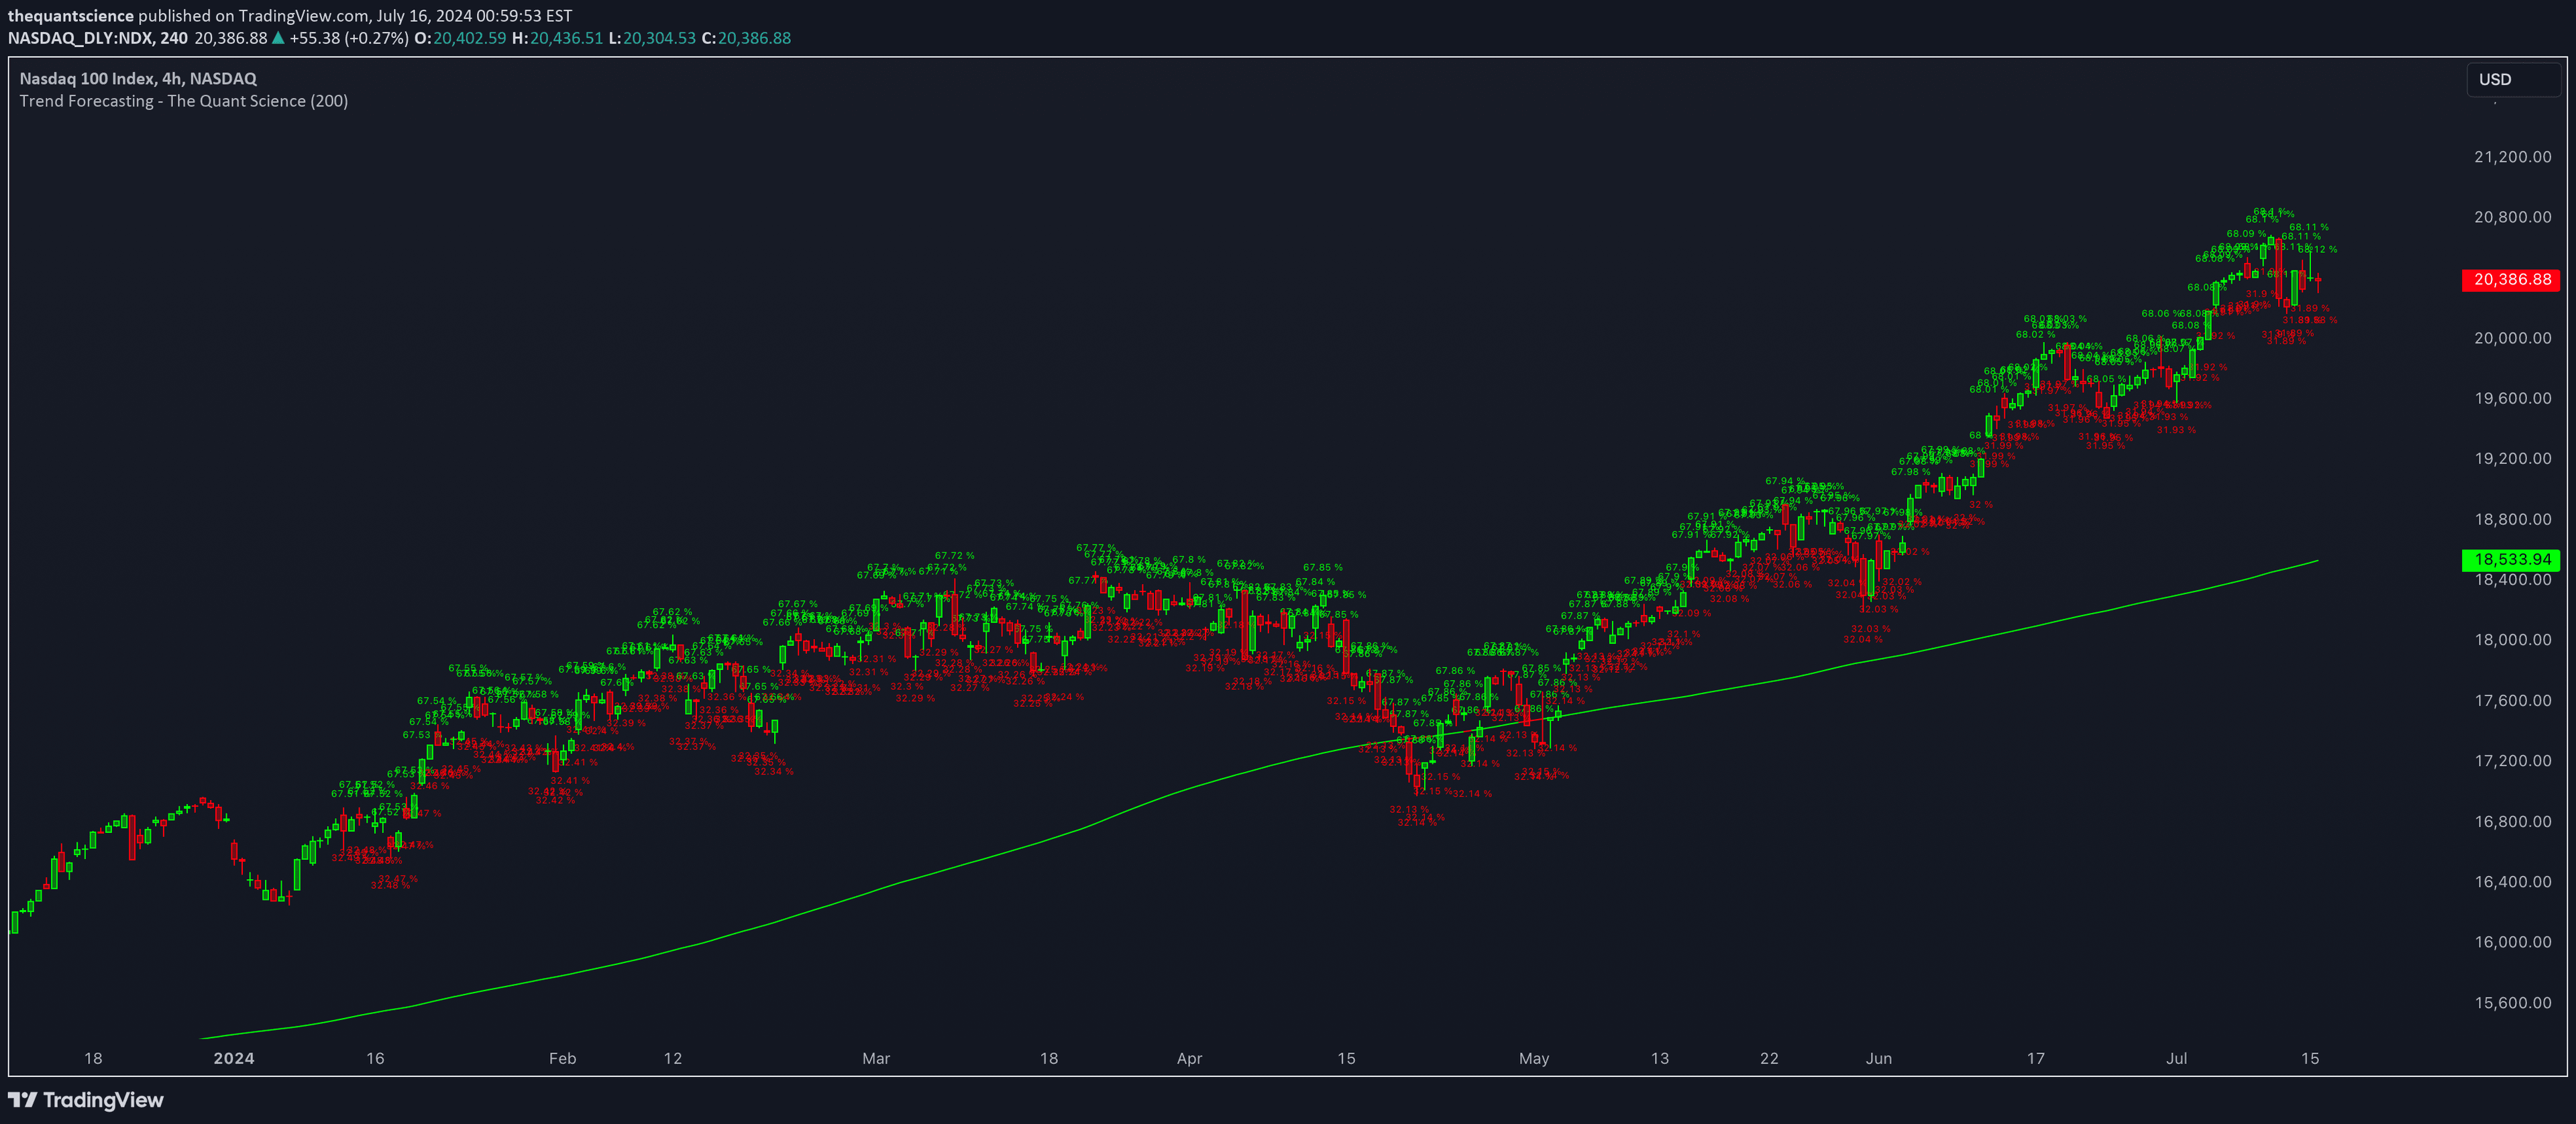
An AI-powered trading indicator that uses k-Nearest Neighbors algorithm to analyze price patterns, predict market movements, and identify trend shifts with advanced multivariate pattern recognition.
Explore complementary indicator rolesHow it works
The AiBitcoinTrend indicator operates by dividing price data into discrete segments, capturing candle bodies, high-low ranges, and wicks. It normalizes these segments using Average True Range (ATR) to ensure consistent analysis across different market conditions.
Using the k-Nearest Neighbors algorithm, the indicator compares current price patterns with a dynamic historical dictionary of multivariate patterns. It calculates Euclidean distances across body ranges, high-low ranges, and wick extremes to identify the most similar historical patterns and generate predictive forecasts.
Why it may be useful
This indicator provides traders with a sophisticated, AI-driven approach to market analysis that goes beyond traditional technical indicators. By leveraging machine learning and multivariate pattern recognition, it offers deeper insights into potential price movements and market dynamics.
The tool's ability to adapt to changing market conditions and provide nuanced trend predictions makes it valuable for traders seeking a more comprehensive and intelligent trading strategy. Its dynamic pattern matching and volatility normalization help reduce noise and enhance prediction reliability.
When to explore it
The AiBitcoinTrend indicator is most effective in markets with sufficient historical data and clear price patterns. It performs exceptionally well in trending markets where distinct price behaviors can be identified and compared across multiple timeframes.
Traders can leverage this tool during periods of relative market stability and when seeking to identify early trend shifts or potential reversals. It is particularly useful for traders who value data-driven, AI-powered analysis and want to go beyond traditional technical indicator approaches.
Keep exploring
What we’ve verified
Access, alerts and repainting behaviour have not been independently verified for this indicator. Check the creator’s current publication and settings.
General descriptions and classifications are recovered research. Verified details above identify the specific checks we have completed. Check the creator’s current publication for later changes.