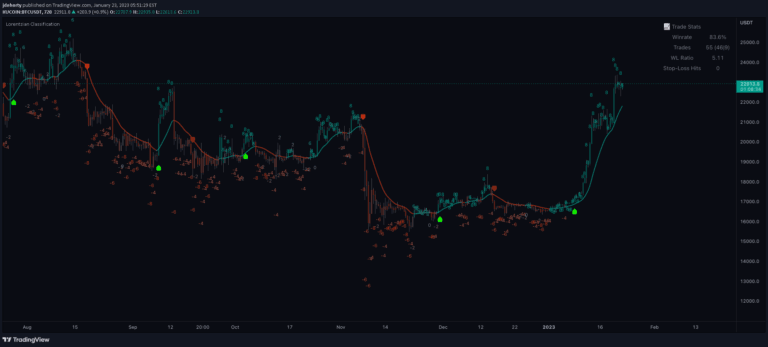
An AI-powered trading indicator using k-Nearest Neighbors algorithm to analyze market trends, predict price movements, and provide intelligent trend navigation for traders.
Explore complementary indicator rolesHow it works
The AI Trend Navigator utilizes the k-Nearest Neighbors (KNN) algorithm to analyze market data by identifying the most similar historical price patterns. It calculates a KNN Moving Average by finding the mean of the 'k' closest values within a specified window, using different price inputs like VWAP or volatility.
The indicator's KNN Classifier function then categorizes price action into positive, negative, or neutral trends by examining the nearest 'k' bars and calculating Euclidean distances. This sophisticated approach allows the algorithm to classify market trends dynamically and adaptively, providing traders with nuanced insights into potential price movements.
Why it may be useful
The AI Trend Navigator offers traders a more sophisticated approach to trend analysis by leveraging machine learning techniques. By using instance-based learning and pattern recognition, the indicator can provide more adaptive and context-aware trend predictions compared to traditional trend-following methods.
Its ability to recognize complex market patterns and dynamically adjust to changing market conditions makes it a powerful tool for traders seeking more intelligent and responsive trend identification. The indicator bridges the gap between traditional technical analysis and modern AI-driven trading strategies.
When to explore it
The AI Trend Navigator is most effective in markets with clear, recognizable price patterns and sufficient historical data for meaningful comparisons. It works best in liquid markets with consistent trading volumes, where historical price behaviors can provide meaningful insights into future movements.
Traders should consider using this indicator during periods of stable market conditions and when seeking a more nuanced approach to trend identification. It is particularly useful for traders who want to combine machine learning techniques with traditional technical analysis to improve their trading decision-making process.
Keep exploring
What we’ve verified
Access, alerts and repainting behaviour have not been independently verified for this indicator. Check the creator’s current publication and settings.
General descriptions and classifications are recovered research. Verified details above identify the specific checks we have completed. Check the creator’s current publication for later changes.