[@btc_charlie] Trader XO Macro Trend Scanner
A trading script combining Exponential Moving Averages (EMAs) and Stochastic RSI to identify market trends, momentum shifts, and potential entry or exit points for traders.
Explore 11,183 indicators. Filter beyond the obvious.
Discover the tools that fit the way you trade.
11,183 tools to explore
A trading script combining Exponential Moving Averages (EMAs) and Stochastic RSI to identify market trends, momentum shifts, and potential entry or exit points for traders.
Wolfe Pattern is a trading strategy that identifies potential trend reversals by analyzing a specific wedge formation and drawing lines connecting key pivot points to determine entry and exit signals.
A multi-symbol scanner that tracks price movements against previous day, week, and month highs and lows, providing visual and alert-based tracking of key market levels.
A multi-ticker dashboard that visually tracks swing structures across different timeframes, helping traders identify potential trend formations and market confluence.
A multi-asset histogram indicator that calculates performance scores for up to 10 different assets, providing a comprehensive visual comparison of their relative trends and strengths.
A trading strategy identifying potential long entry opportunities by analyzing volume, price movements, and technical indicators to spot high-probability stock trades.
An RSI Divergence Scanner that tracks bullish and bearish signals across multiple assets, identifying potential trend reversals by comparing price action to RSI momentum.
OKX Signal BOT is a strategy scanning and trading tool for cryptocurrency futures on the OKX exchange, allowing traders to design custom trading strategies and automate signal execution.
A trading signal predicting potential price rises and falls by calculating RSI and TSI values, providing Long and Short labels on price-time charts.
Advanced multi-symbol tech stock scanner using EMA, RSI, and volume analysis to detect trend changes and generate precise trading signals across six key technology stocks.
A multi-timeframe Supertrend indicator that analyzes market trends across different periods, using ATR and customizable settings to help traders identify trend directions and potential reversals.
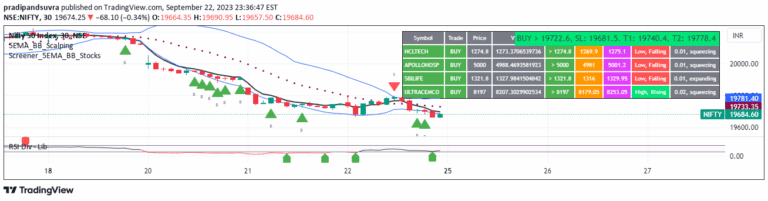
A dynamic trading scanner that identifies potential buy and sell signals for Nifty-50 stocks using 5-EMA and Bollinger Bands, providing real-time trade recommendations.
Likes, views, and comments are historical TradingView snapshots. They describe attention, not trading performance.