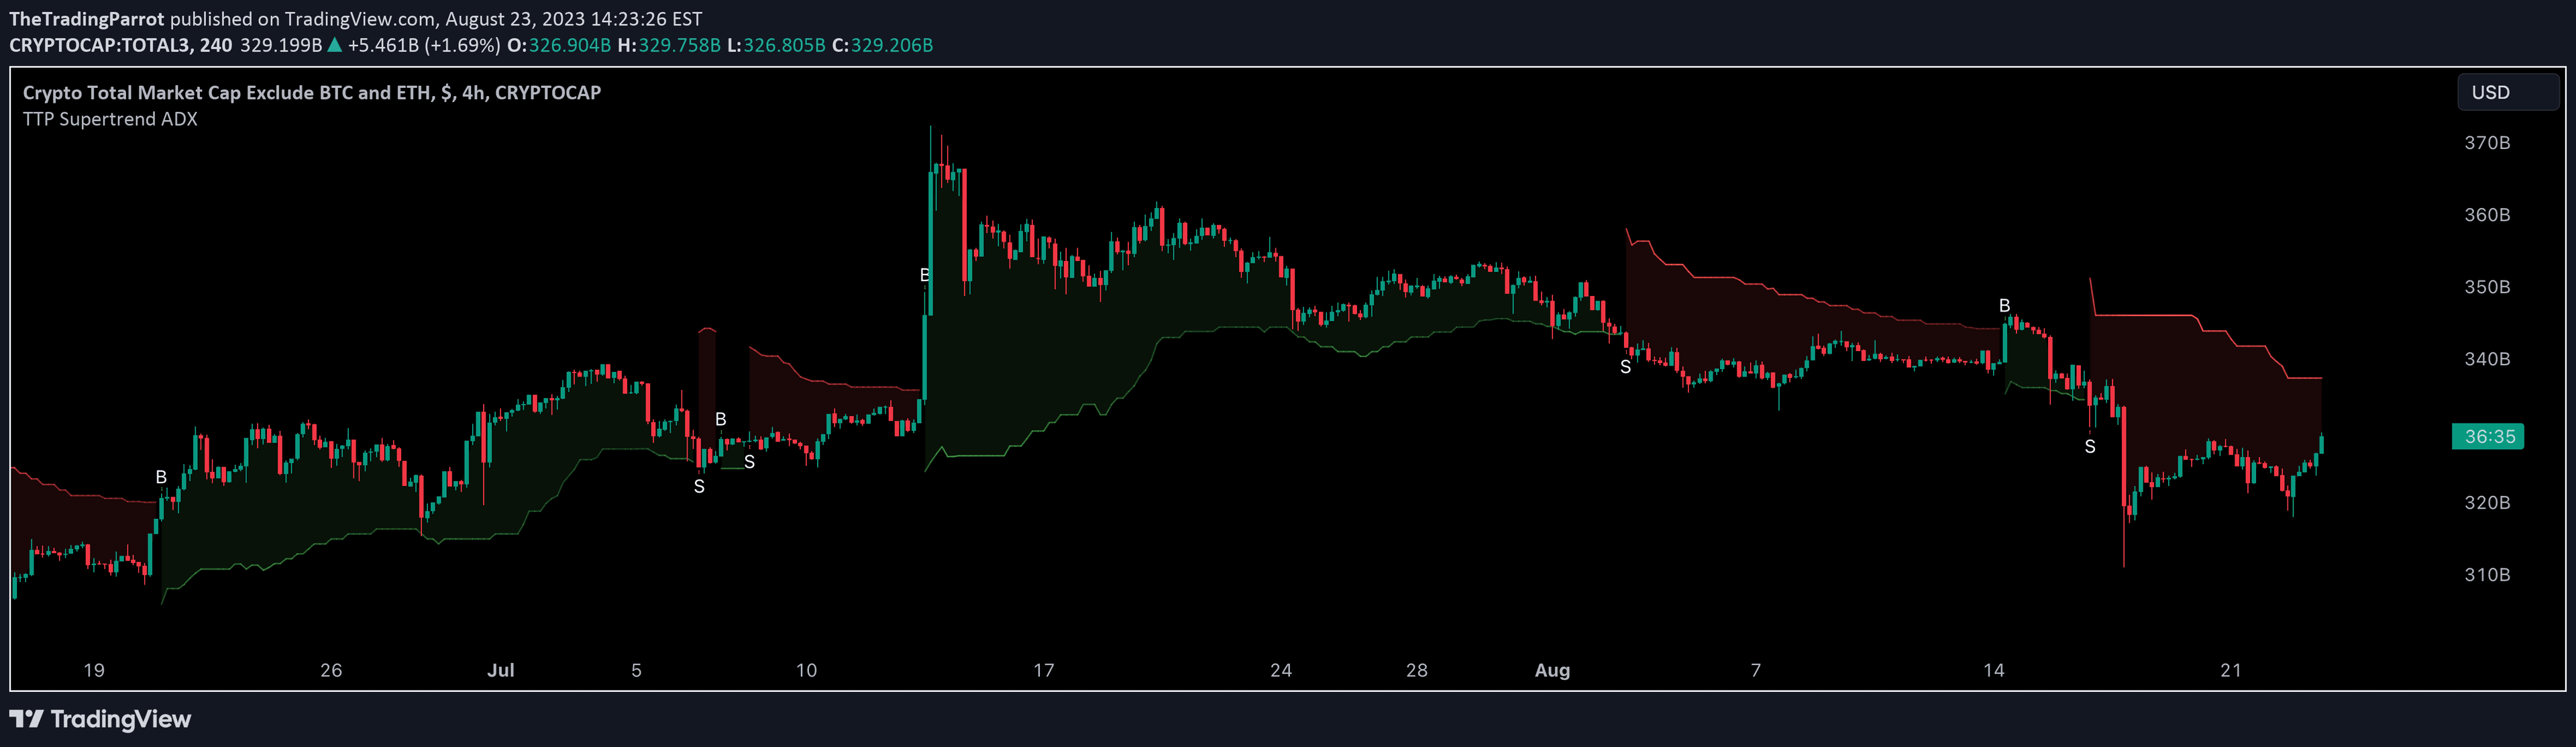
A multi-timeframe Supertrend indicator that analyzes market trends across different periods, using ATR and customizable settings to help traders identify trend directions and potential reversals.
Explore complementary indicator rolesHow it works
The MTF Supertrend Indicator calculates trend direction using the Average True Range (ATR) multiplied by a configurable factor, which helps detect changes in market volatility and trend momentum. It computes Supertrend values across multiple timeframes, prioritizing higher timeframe trends to provide a comprehensive market perspective.
The indicator employs color-coded visual representations to distinguish between bullish and bearish trends, making it easy for traders to quickly interpret market conditions. By allowing customization of sensitivity parameters like factor and ATR period, traders can fine-tune the indicator to match their specific trading style and market analysis preferences.
Why it may be useful
The MTF Supertrend Indicator provides traders with a sophisticated tool for understanding market trends across different timeframes, which is crucial for making informed trading decisions. By offering a layered view of trend directions, it helps traders confirm potential entry and exit points more accurately and reduces the risk of trading against the dominant market trend.
Its adaptive display and customizable settings make it valuable for traders of all experience levels, from day traders seeking short-term opportunities to position traders looking for long-term investment insights. The ability to filter and prioritize trends helps traders cut through market noise and focus on the most significant price movements.
When to explore it
The MTF Supertrend Indicator is most effective in volatile market conditions where trend identification can be challenging, such as during significant economic events or in markets with rapid price fluctuations. It works particularly well when traders need a comprehensive view of market trends across multiple timeframes, helping to validate trading signals and reduce false positives.
Traders should utilize this indicator when they want to enhance their trend analysis strategy, especially when looking to confirm trend reversals or identify potential momentum shifts. It is particularly useful in markets like cryptocurrencies, stocks, and forex, where understanding multi-timeframe trends can provide a significant competitive advantage.
Keep exploring
What we’ve verified
Access, alerts and repainting behaviour have not been independently verified for this indicator. Check the creator’s current publication and settings.
General descriptions and classifications are recovered research. Verified details above identify the specific checks we have completed. Check the creator’s current publication for later changes.