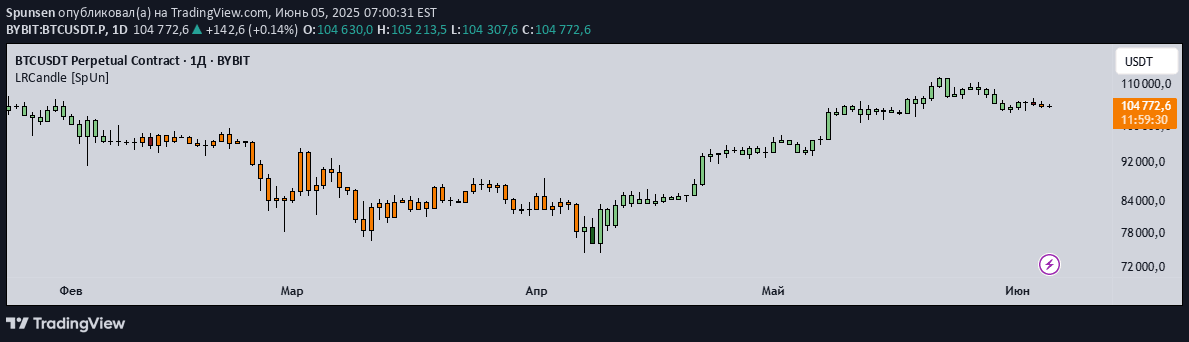
A script that identifies candle direction by comparing current and previous candle closes, highlighting the last candle and offering configurable alerts for trading decisions.
Explore complementary indicator rolesHow it works
The script analyzes price action by comparing the close of the current candle with the previous candle's close. It specifically focuses on the last bar, applying highlighting and alert conditions only to the most recent candle. By tracking whether the current candle closes above or below the preceding candle, traders can quickly identify potential directional changes in the market.
The indicator provides visual and alert mechanisms to draw attention to these potential shifts. When enabled, it can highlight the last candle in yellow if it meets the specified close condition, making it easy for traders to spot significant price movements. The script's flexibility allows users to customize the timeframe and alert settings according to their specific trading strategy.
Why it may be useful
Tracking candle close relationships provides traders with a simple yet effective method to understand short-term price momentum and potential trend changes. By comparing consecutive candle closes, traders can gain insights into immediate market sentiment and potential directional shifts without complex calculations.
The script's key strength lies in its simplicity and customization. Traders can easily configure alerts and visual indicators to match their trading style, making it a versatile tool for quickly assessing market conditions. The ability to set specific timeframes and alert conditions allows for targeted analysis across different trading scenarios.
When to explore it
This signal works best in markets with clear short-term price trends and where quick identification of potential directional changes is crucial. It is particularly useful for traders who focus on rapid price movements and require immediate visual cues about market behavior. The indicator can be especially valuable during volatile market conditions where quick decision-making is essential.
Traders should consider using this script in timeframes that match their trading style, from scalping to day trading. It is most effective when combined with other technical analysis tools and used as part of a comprehensive trading strategy. The script's flexibility makes it suitable for various markets, including stocks, forex, cryptocurrencies, and commodities.
Keep exploring
What we’ve verified
Access, alerts and repainting behaviour have not been independently verified for this indicator. Check the creator’s current publication and settings.
General descriptions and classifications are recovered research. Verified details above identify the specific checks we have completed. Check the creator’s current publication for later changes.