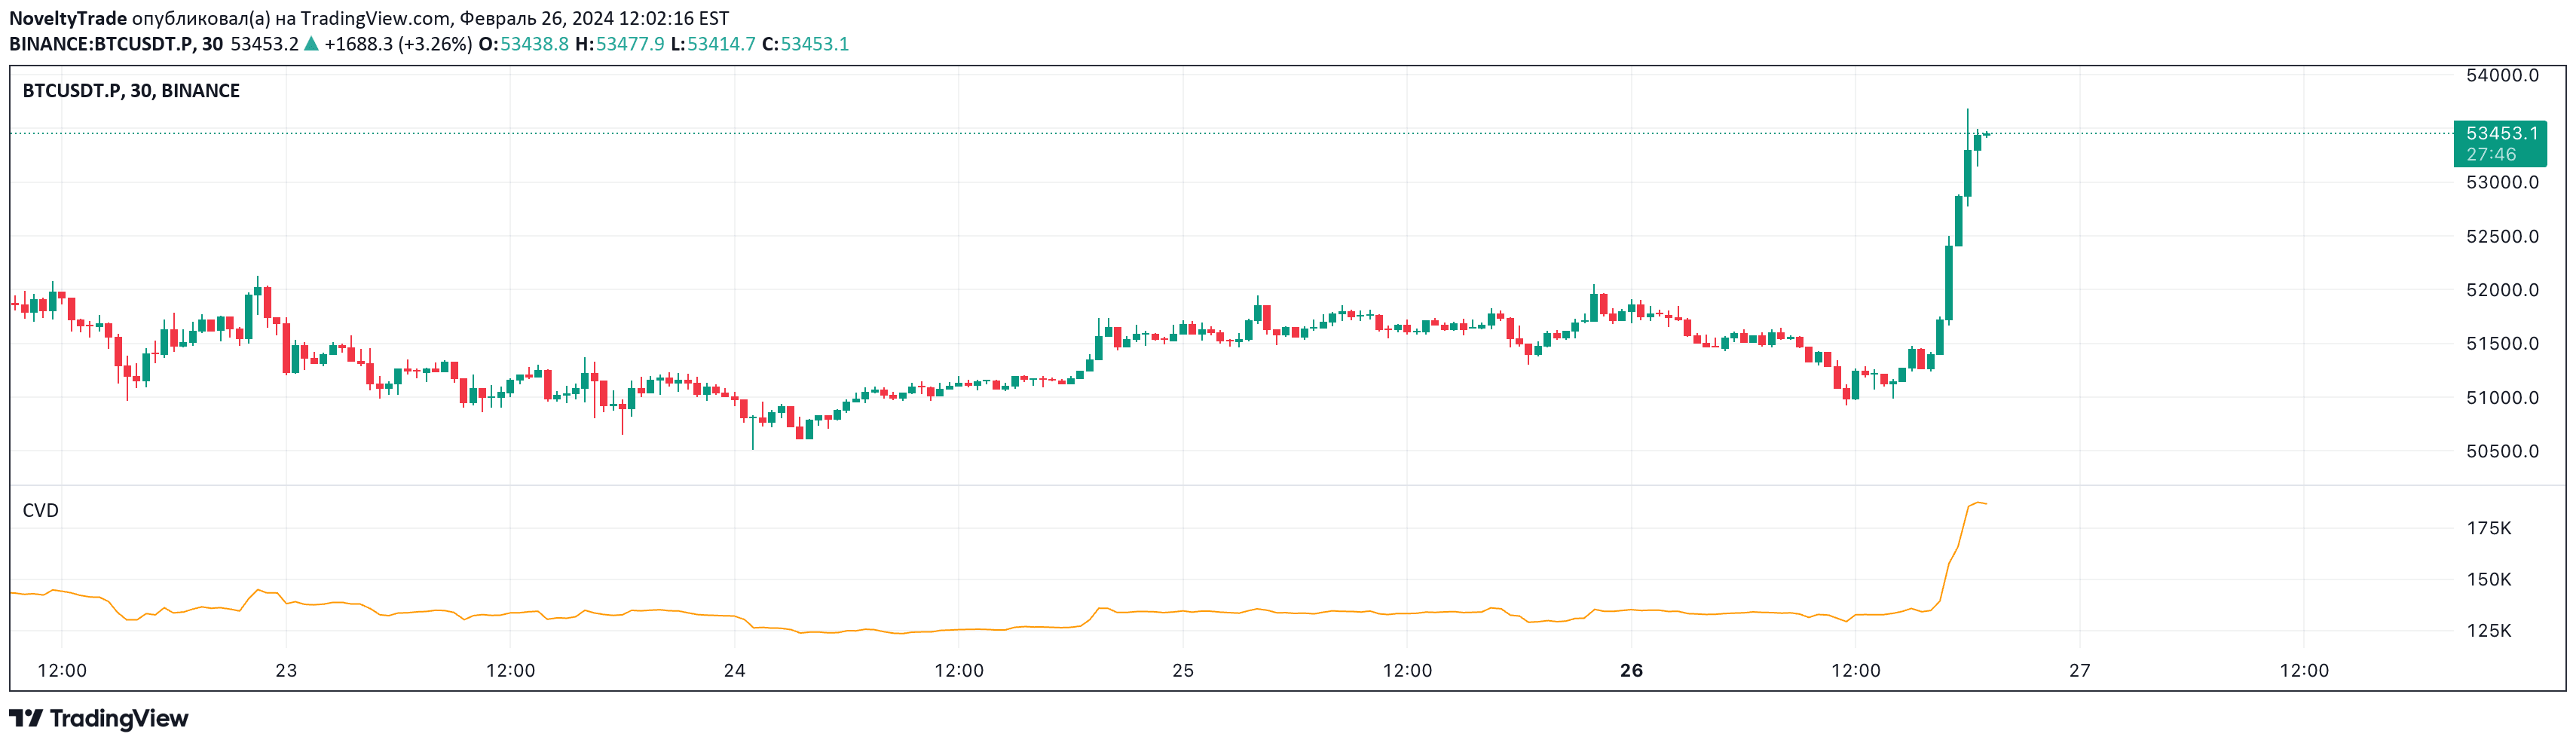
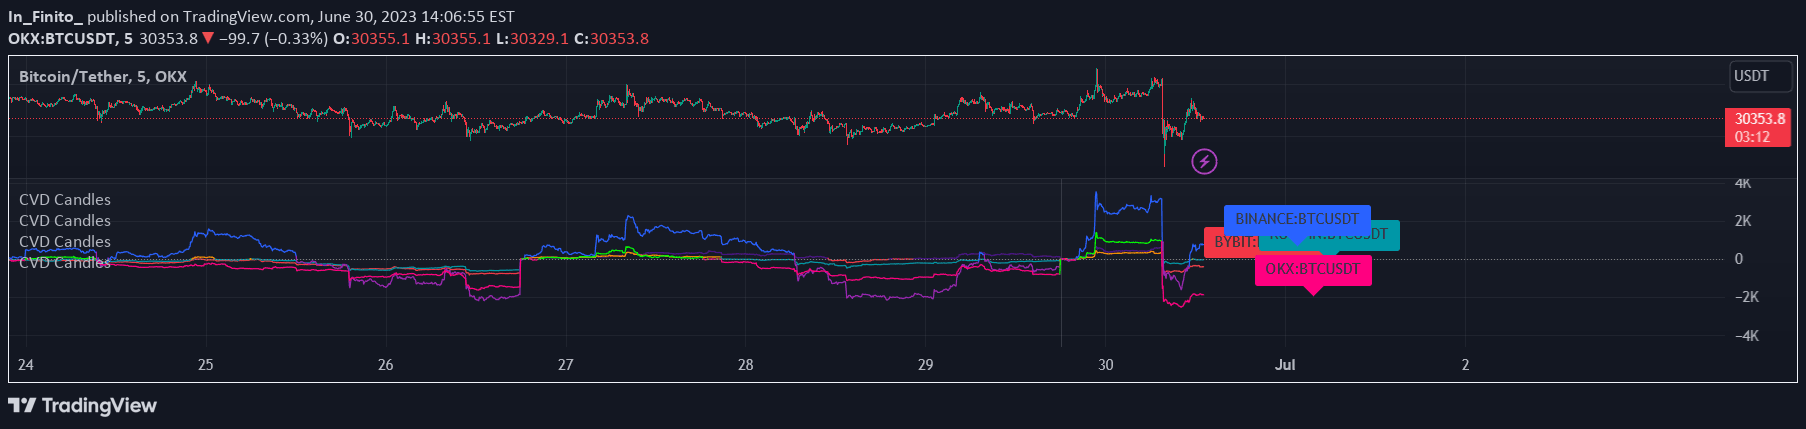
A volume delta divergence oscillator that identifies market tension by comparing normalized Cumulative Volume Delta against price movement, revealing smart money activity and potential market reversals.
Explore complementary indicator rolesHow it works
The CVD Divergence Insights indicator calculates Cumulative Volume Delta by analyzing buy versus sell volume pressure across different timeframes. It generates a normalized divergence oscillator by comparing smoothed CVD with smoothed price movements, creating a dynamic visualization of market imbalances.
The system includes optional volume weighting to emphasize high-conviction moves and filter out low-volume noise. It also incorporates statistical spike detection using standard deviation, highlighting unusually large divergence activities through color-coded indicators that help traders identify potential market turning points.
Why it may be useful
This indicator provides traders with a sophisticated tool to understand underlying market dynamics beyond simple price action. By revealing tension between price movement and volume aggression, it helps identify potential absorption zones, failed pressure scenarios, and hidden market strength or weakness.
The CVD Divergence Insights allows traders to align their strategies with smart money activity, offering deeper insights into market psychology and potential trend reversals. It transforms complex volume delta information into actionable visual signals that can enhance trading decision-making across multiple timeframes.
When to explore it
The CVD Divergence Insights works best in markets with significant volume and clear price movements, such as major forex pairs, liquid stocks, and cryptocurrency markets. Traders should pay special attention to moments when the oscillator shows divergence between price and volume, indicating potential trend reversals or continuation signals.
It is particularly useful during periods of market transition, breakouts, and when seeking confirmation of existing trend strength. Combining this indicator with other volume and trend analysis tools can provide a more comprehensive view of market dynamics and potential trading opportunities.
Keep exploring
What we’ve verified
Access, alerts and repainting behaviour have not been independently verified for this indicator. Check the creator’s current publication and settings.
General descriptions and classifications are recovered research. Verified details above identify the specific checks we have completed. Check the creator’s current publication for later changes.