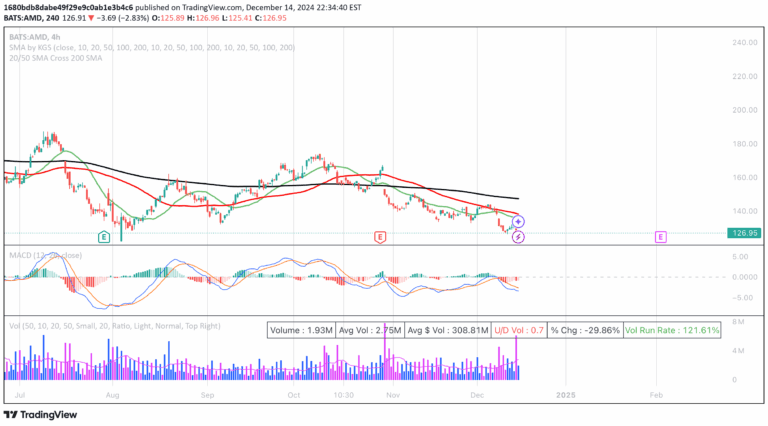
A trading signal tracking 7 consecutive price closes above/below the 5-period Simple Moving Average, designed to identify trend persistence and potential short-term reversals.
Explore complementary indicator rolesHow it works
The indicator monitors price movement relative to the 5-period Simple Moving Average (SMA), tracking consecutive closes above or below this key level. When seven consecutive closes occur in the same direction, it signals a potential trend continuation or reversal, providing traders with a clear visual representation of price momentum.
By using a straightforward counting mechanism, the signal identifies periods of sustained price movement that deviate from the short-term moving average. Traders can observe these clusters of consecutive closes to understand the current market sentiment and potential directional shifts in price action.
Why it may be useful
This signal helps traders identify potential trend shifts and momentum changes by providing a structured method for analyzing price movement around a key short-term moving average. It offers a systematic approach to recognizing when price may be developing a consistent directional bias, which can be crucial for making informed trading decisions.
By focusing on the 5-period SMA, the indicator creates a simple yet effective framework for understanding market dynamics. Traders can use this signal to develop more nuanced entry and exit strategies, leveraging the information about trend persistence and potential reversals.
When to explore it
The signal works best in markets with clear trending behavior, where price demonstrates consistent movement above or below the 5-period SMA. It is particularly effective in identifying potential trend continuation setups and short-term reversal opportunities across various timeframes and financial instruments.
Traders should combine this signal with additional technical analysis tools, such as longer-term moving averages or complementary indicators, to confirm potential trade setups. The indicator is most valuable when used alongside price action analysis and a comprehensive understanding of market context.
Keep exploring
What we’ve verified
Access, alerts and repainting behaviour have not been independently verified for this indicator. Check the creator’s current publication and settings.
General descriptions and classifications are recovered research. Verified details above identify the specific checks we have completed. Check the creator’s current publication for later changes.