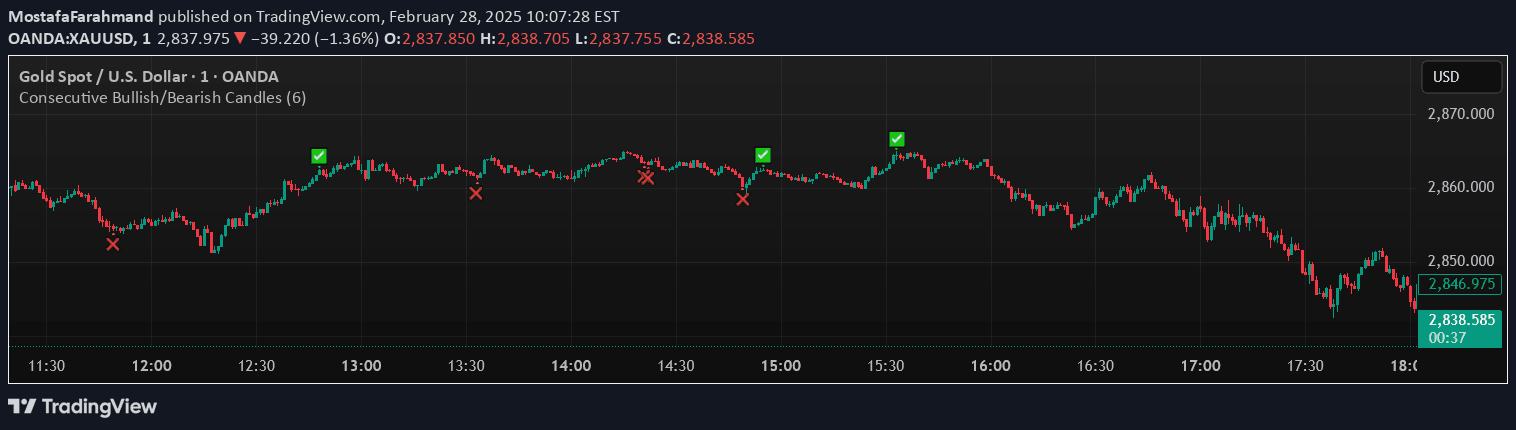
Bullish and bearish engulfing patterns are key candlestick reversal signals that indicate potential trend changes by showing significant price momentum shifts in trading.
Explore complementary indicator rolesHow it works
Bullish and bearish engulfing patterns are powerful candlestick formations that signal potential trend reversals in financial markets. In a bullish engulfing pattern, a smaller bearish candle is completely engulfed by a larger subsequent bullish candle, indicating a potential shift from bearish to bullish momentum. Conversely, a bearish engulfing pattern occurs when a smaller bullish candle is completely covered by a larger bearish candle, suggesting a potential transition from bullish to bearish trend.
Traders identify these patterns by closely examining the relationship between consecutive candlesticks, focusing on their body sizes and relative positions. The key characteristic is that the second candle must completely encompass the previous candle's body, signaling a strong potential for trend reversal and providing traders with a visual representation of shifting market sentiment.
Why it may be useful
Engulfing patterns are crucial for traders because they provide clear visual signals of potential market sentiment shifts and trend reversals. These patterns help traders identify moments when buying or selling pressure is overwhelming, offering insights into potential entry and exit points. By revealing the psychology of market participants, engulfing patterns can help traders make more informed decisions about potential trend changes.
The significance of these patterns lies in their ability to capture rapid momentum shifts and provide early warning signals for potential trend reversals. They offer traders a quick and intuitive way to assess market dynamics, helping to identify potential trading opportunities across various financial instruments and timeframes.
When to explore it
Engulfing patterns are most effective when used in conjunction with other technical analysis tools and during periods of clear market trends. Traders should look for these patterns in trending markets, where they can provide more reliable signals about potential reversals. They work best on higher timeframes like daily or weekly charts, where the patterns have more statistical significance and represent more substantial market movements.
Traders should be cautious and confirm engulfing patterns with additional indicators such as volume, support and resistance levels, or momentum oscillators. They are particularly useful in volatile markets and can be applied across various financial instruments including stocks, forex, cryptocurrencies, and commodities. The reliability of these patterns increases when they appear at key technical levels or during significant market events.
Keep exploring
What we’ve verified
Access, alerts and repainting behaviour have not been independently verified for this indicator. Check the creator’s current publication and settings.
General descriptions and classifications are recovered research. Verified details above identify the specific checks we have completed. Check the creator’s current publication for later changes.