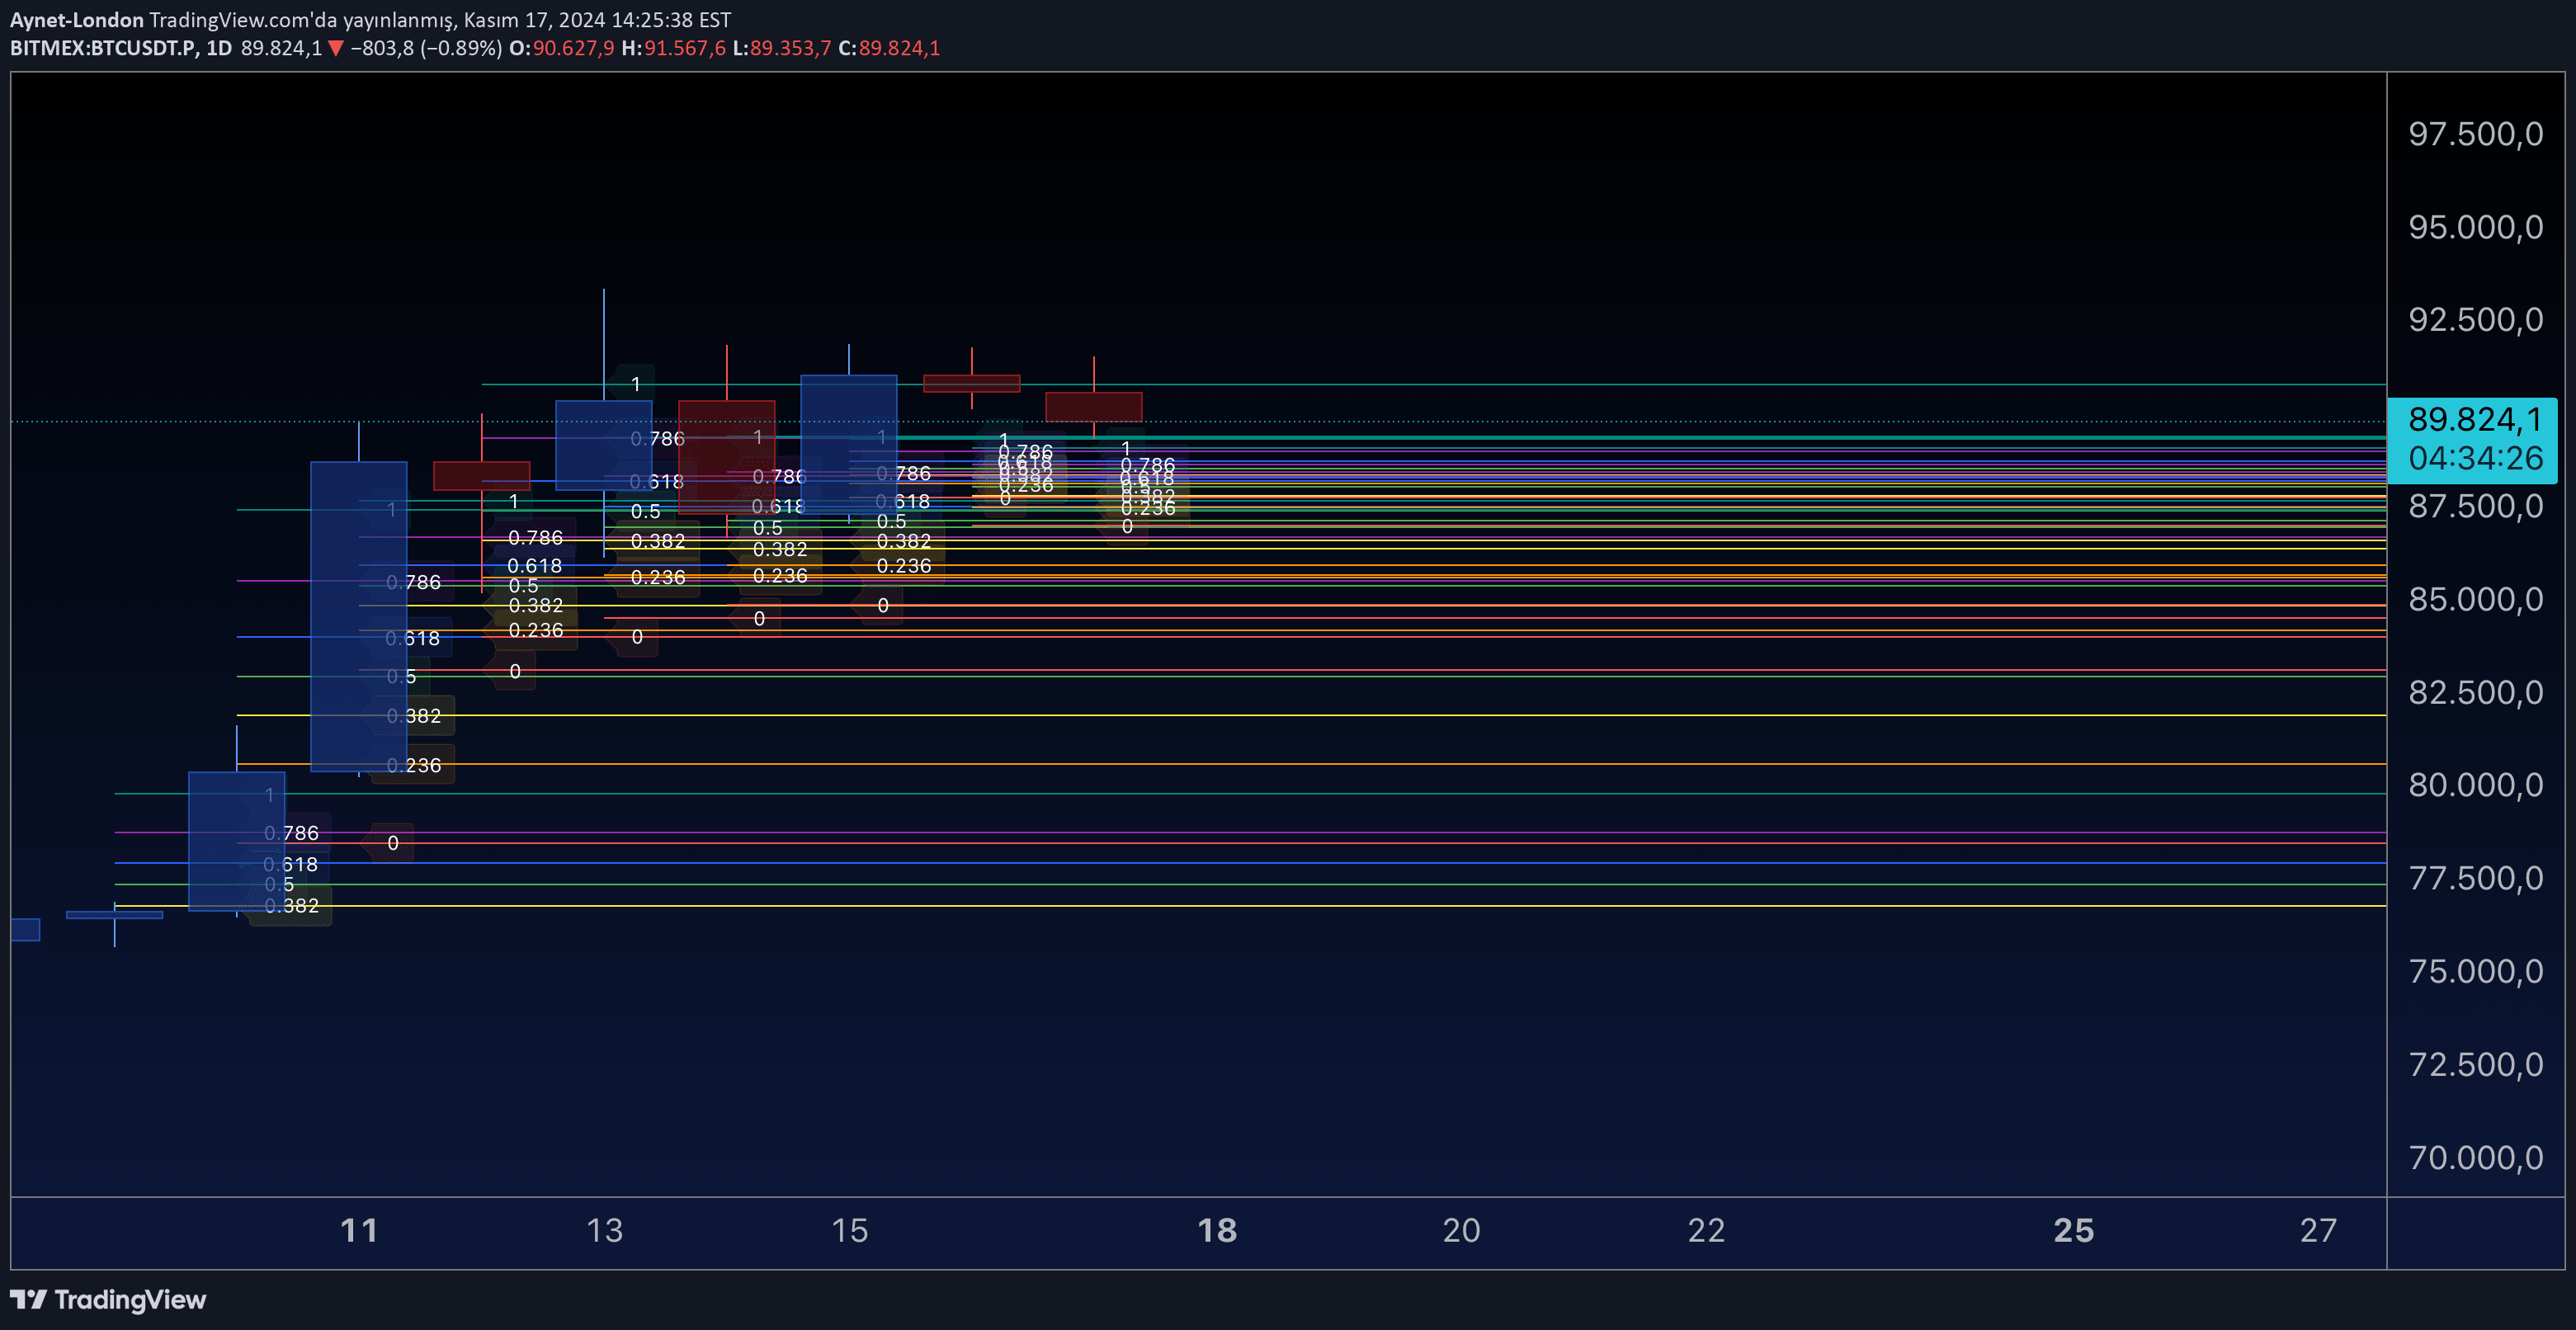
A.I Fibonacci is an advanced trading tool that automatically calculates and highlights crucial Fibonacci extension levels for potential price entries, exits, and stop losses across different markets.
Explore complementary indicator rolesHow it works
The A.I Fibonacci script automatically analyzes price movements by identifying key highs and lows on the chart. It then calculates and plots Fibonacci extension levels that represent potential price reversal and continuation zones.
By using advanced algorithmic calculations, the tool generates color-coded levels that traders can use for strategic decision-making. Green levels indicate potential entry points, red levels represent stop loss zones, and yellow levels show take profit areas.
Why it may be useful
The A.I Fibonacci provides traders with a systematic approach to identifying potential price levels during market retracements. By offering precise, mathematically-derived levels, it helps traders make more informed and objective trading decisions across various financial markets.
Unlike traditional Fibonacci tools, this script goes beyond simple retracement analysis by pinpointing both potential reversal areas and future price projection levels. This comprehensive approach enables traders to develop more robust trading strategies with clearer entry, exit, and risk management parameters.
When to explore it
The A.I Fibonacci is most effective in markets showing clear trend movements and discernible price swings. It performs optimally in trending markets where price has recently experienced a significant move and is likely to retrace or continue its primary trend direction.
Traders should ideally use this tool in conjunction with other technical indicators and analysis methods to confirm signals and validate potential trade setups. It is particularly useful in forex, stocks, commodities, and other liquid markets with sufficient price volatility.
Keep exploring
What we’ve verified
Access, alerts and repainting behaviour have not been independently verified for this indicator. Check the creator’s current publication and settings.
General descriptions and classifications are recovered research. Verified details above identify the specific checks we have completed. Check the creator’s current publication for later changes.