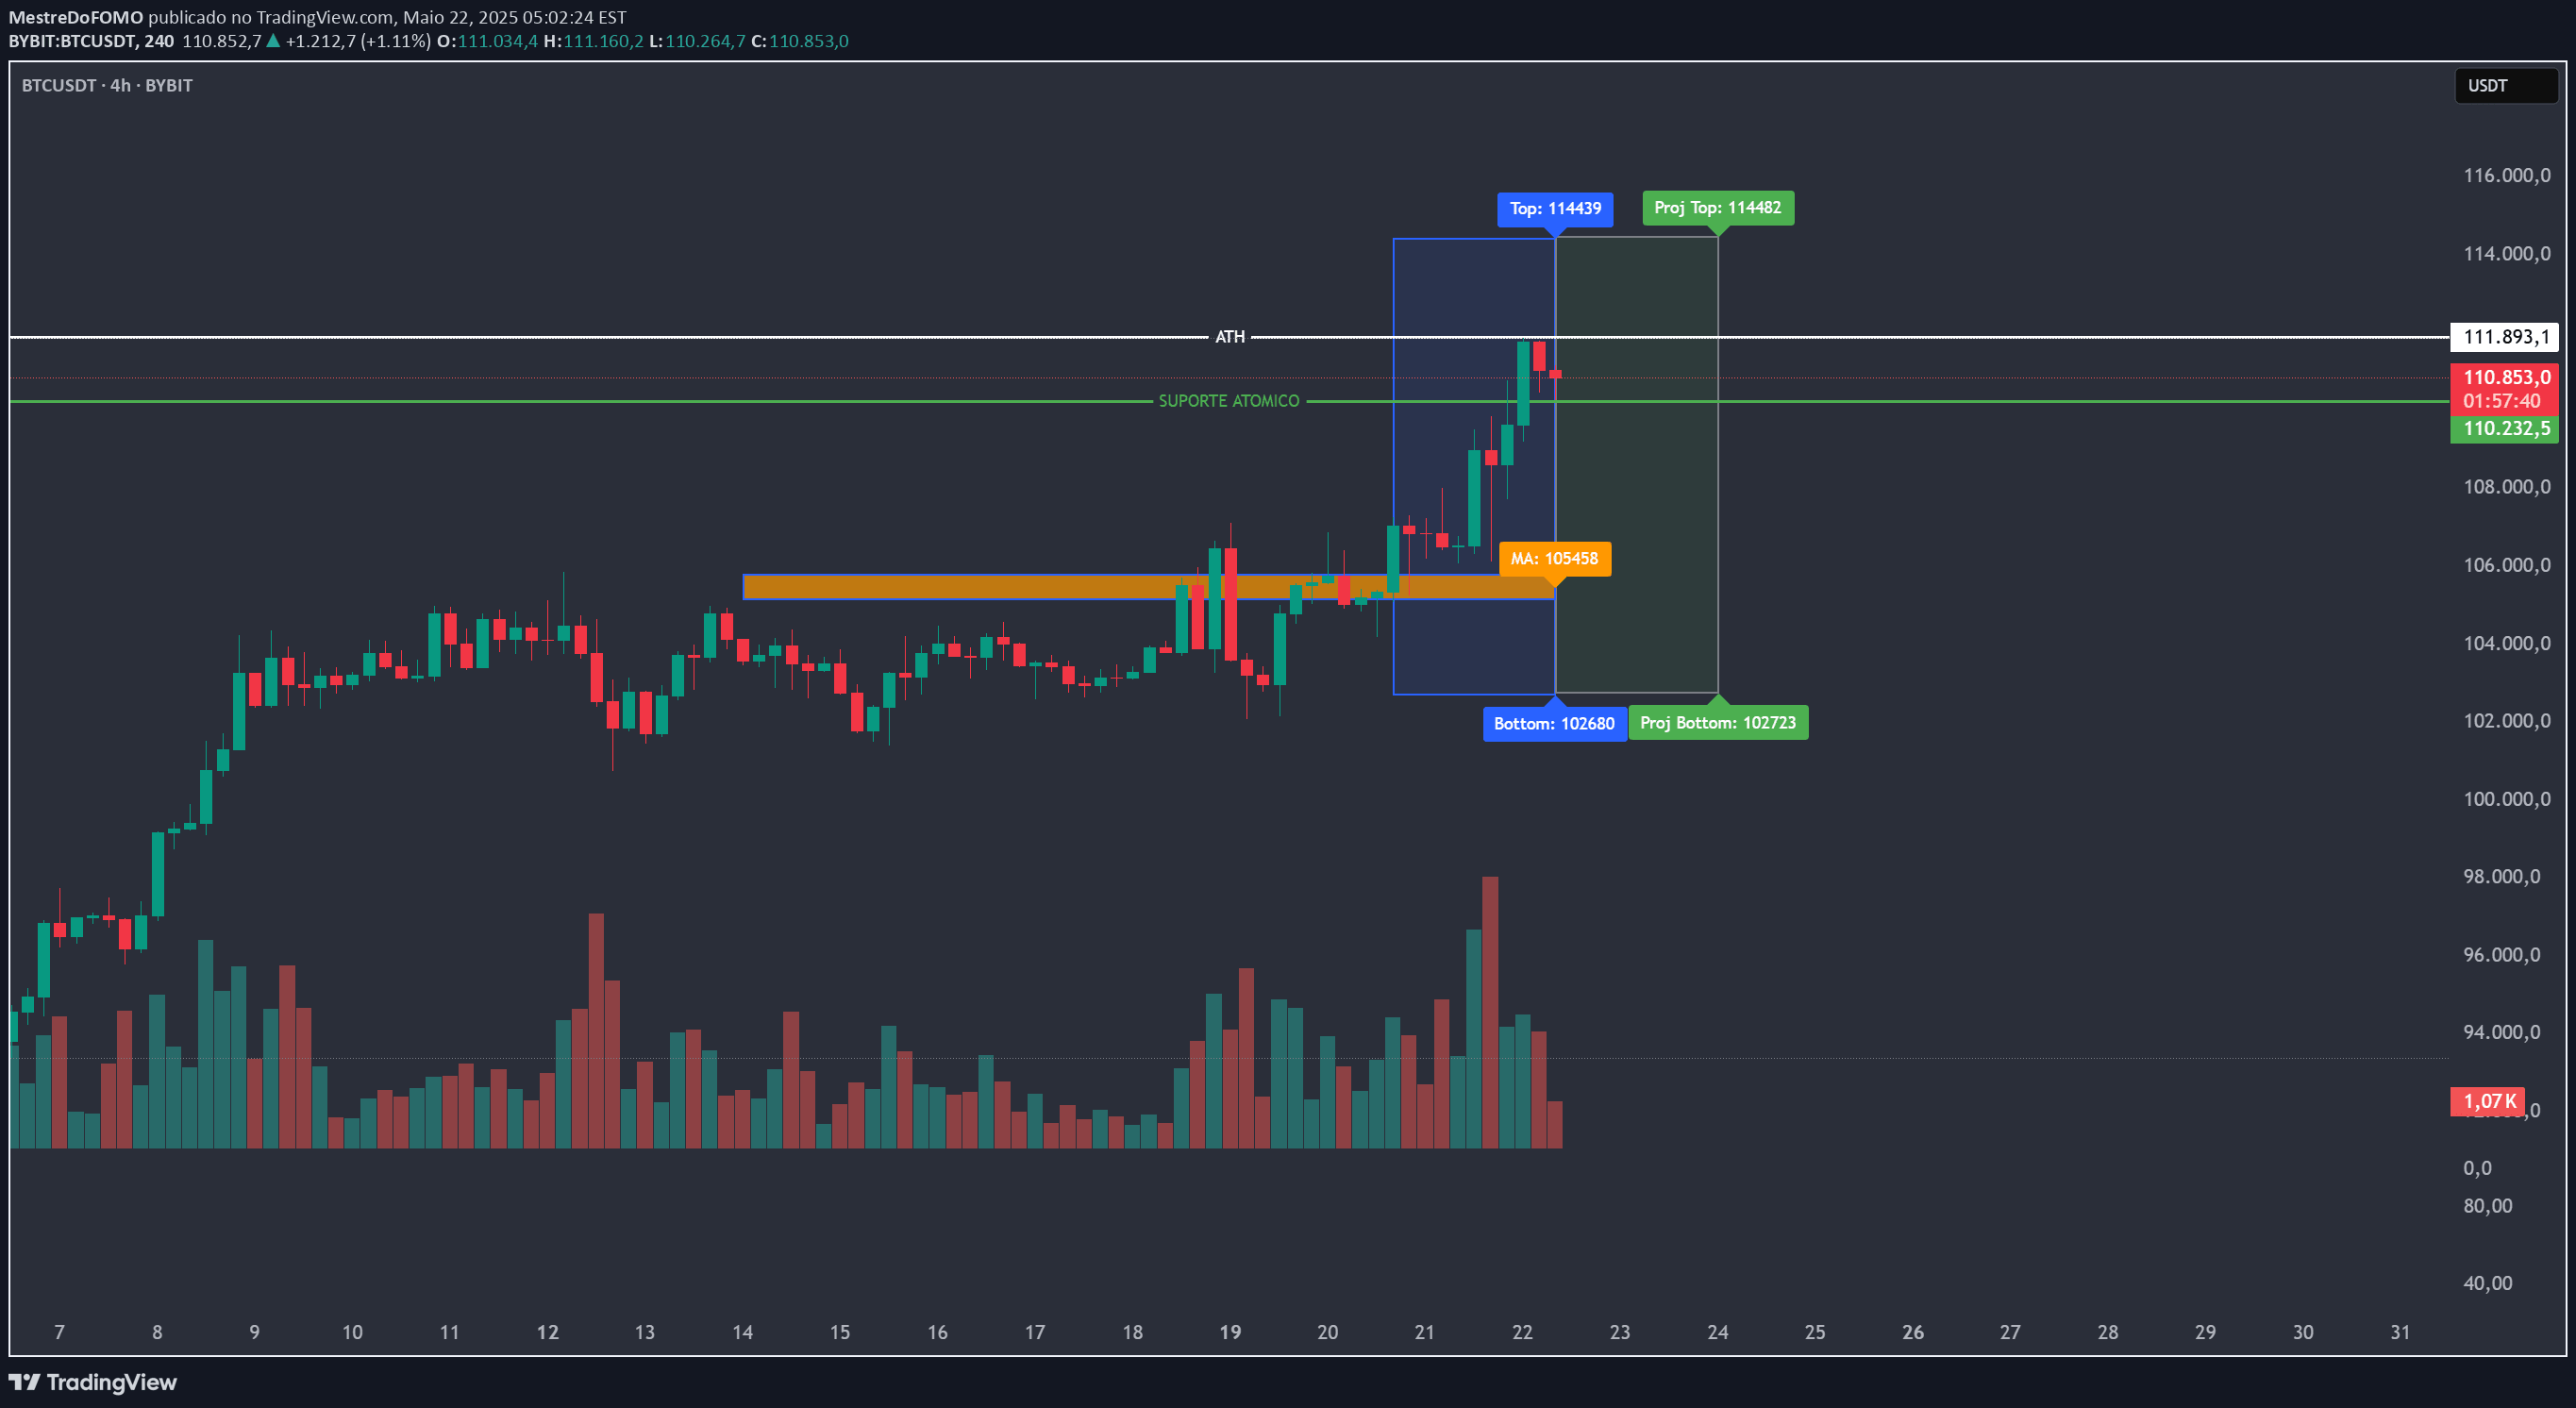
A multi-timeframe swing analysis tool that identifies key price levels and market structure by tracking swing highs and lows across different timeframes.
Explore complementary indicator rolesHow it works
The Algo Structure indicator analyzes price movements by detecting swing highs and lows across multiple timeframes, starting with the current chart timeframe and expanding to weekly and monthly perspectives. It identifies swings using a 3-bar high/low pattern, marking significant price points with horizontal lines and percentage distance labels.
The tool tracks swing points on different timeframes, creating a comprehensive view of market structure. It generates visual elements including horizontal lines, labels showing timeframe context, and an information table that summarizes key price levels and their relationships.
Why it may be useful
This indicator provides traders with a holistic view of market structure by revealing important price levels across multiple timeframes. It helps traders understand the broader market context, identifying potential support and resistance zones that might be missed when analyzing a single timeframe.
By presenting percentage distances and comparative levels, the tool offers insights into market volatility and potential trading opportunities. It enables traders to make more informed decisions by visualizing key price points and understanding the relationship between different timeframe perspectives.
When to explore it
The Algo Structure indicator is most effective for traders looking to perform multi-timeframe analysis and identify significant market levels. It works well for traders seeking to confirm trends, detect potential breakout opportunities, and understand the broader market context beyond the immediate chart view.
Traders can utilize this tool for various strategies, including breakout trading, mean reversion, and support/resistance trading. It is particularly valuable for those who want to incorporate a comprehensive view of market structure into their trading approach, helping to validate potential entry and exit points across different timeframes.
Keep exploring
What we’ve verified
Access, alerts and repainting behaviour have not been independently verified for this indicator. Check the creator’s current publication and settings.
General descriptions and classifications are recovered research. Verified details above identify the specific checks we have completed. Check the creator’s current publication for later changes.