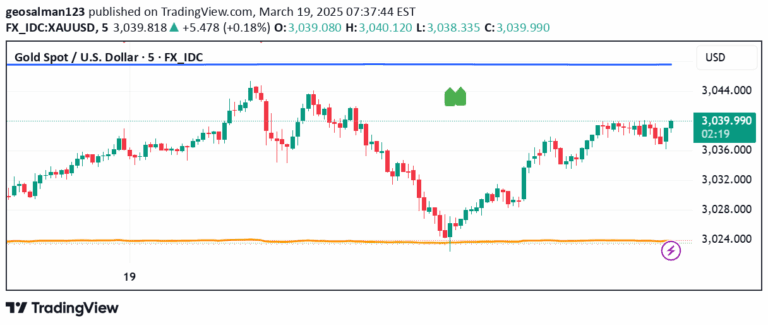
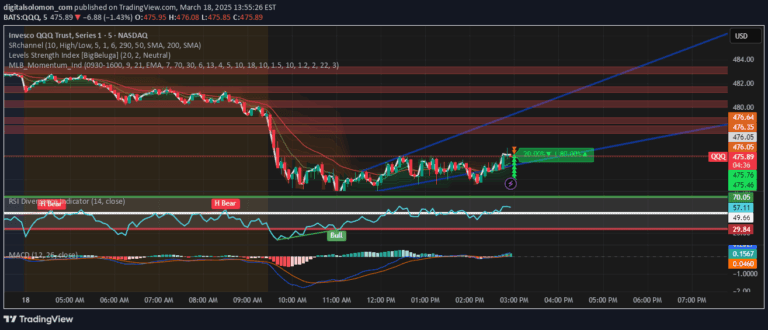
A sophisticated price anomaly detection tool that identifies unusual price movements by analyzing statistical deviations from typical market behavior and highlighting potential trading opportunities.
Explore complementary indicator rolesHow it works
The Price Anomaly Detector operates by calculating statistical variations in price data using a standard deviation threshold and a defined window length. It continuously analyzes price movements, comparing each data point against historical price behavior to determine significant deviations.
When an anomaly is detected, the indicator flags the specific price point by changing the background color and placing a cross marker. Traders can customize the sensitivity by adjusting the standard deviation threshold and window length, allowing for tailored anomaly detection across different market conditions and trading instruments.
Why it may be useful
Price anomaly detection helps traders identify potential market turning points and unusual price movements that might signal significant shifts in market sentiment. By highlighting statistical outliers, the tool provides early warning signals that could precede meaningful price reversals or trend changes.
The indicator's ability to quantify and visualize price irregularities gives traders an objective method to assess market behavior beyond subjective visual interpretation. This systematic approach allows for more disciplined trading decisions by providing a data-driven perspective on price dynamics.
When to explore it
The Price Anomaly Detector works best in markets with moderate to high volatility, where price movements can deviate significantly from average behavior. It is particularly useful during periods of economic news releases, earnings announcements, or other events that might trigger sudden price fluctuations.
Traders should use this tool in conjunction with other technical and fundamental analysis methods to confirm signals and reduce false positives. It is most effective when applied to liquid markets with sufficient trading volume and when combined with a comprehensive risk management strategy.
Keep exploring
What we’ve verified
Access, alerts and repainting behaviour have not been independently verified for this indicator. Check the creator’s current publication and settings.
General descriptions and classifications are recovered research. Verified details above identify the specific checks we have completed. Check the creator’s current publication for later changes.