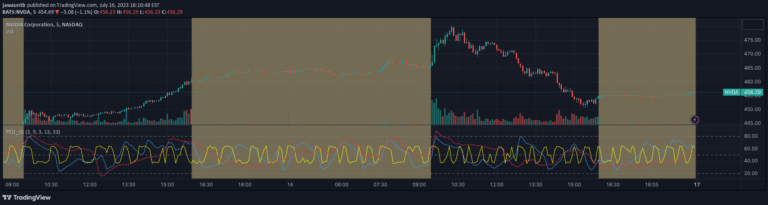
The ATR Oscillator with Dots visualizes market volatility through color-coded dots, revealing price movement intensity and market dynamics using Average True Range.
Explore complementary indicator rolesHow it works
The ATR Oscillator with Dots calculates the Average True Range to measure price volatility, representing market movements through discrete colored dots. Green dots indicate upward price movement when the current close is higher than the previous close, while red dots signify downward movement when the current close is lower than the previous close.
The positioning and frequency of these dots provide visual insights into market behavior. Dots positioned further from the zero line suggest significant price changes, while clusters near the zero line indicate market consolidation. The oscillator's dynamic dot placement helps traders quickly interpret market volatility and potential trend shifts.
Why it may be useful
The ATR Oscillator with Dots simplifies complex volatility analysis by transforming numerical data into an intuitive visual representation. Traders can instantly gauge market dynamics through color and dot spacing, making it easier to understand price momentum and potential trend changes without extensive mathematical calculations.
This tool provides rapid insights into market conditions, helping traders make more informed decisions during volatile or uncertain trading environments. By highlighting periods of high activity and consolidation, the oscillator enables traders to adapt their strategies quickly and identify potential entry and exit points more effectively.
When to explore it
The ATR Oscillator with Dots is most effective during periods of significant market movement and potential trend transitions. Traders should pay close attention when the dots show frequent color changes and wide spacing, indicating high volatility and potential trading opportunities. These scenarios often occur during economic announcements, earnings reports, or major market events.
Conversely, the oscillator is valuable during consolidation phases, where dot clusters remain tight around the zero line. These periods suggest reduced market activity and can help traders prepare for potential breakout scenarios or adjust their trading strategies to match current market conditions.
Keep exploring
What we’ve verified
Access, alerts and repainting behaviour have not been independently verified for this indicator. Check the creator’s current publication and settings.
General descriptions and classifications are recovered research. Verified details above identify the specific checks we have completed. Check the creator’s current publication for later changes.