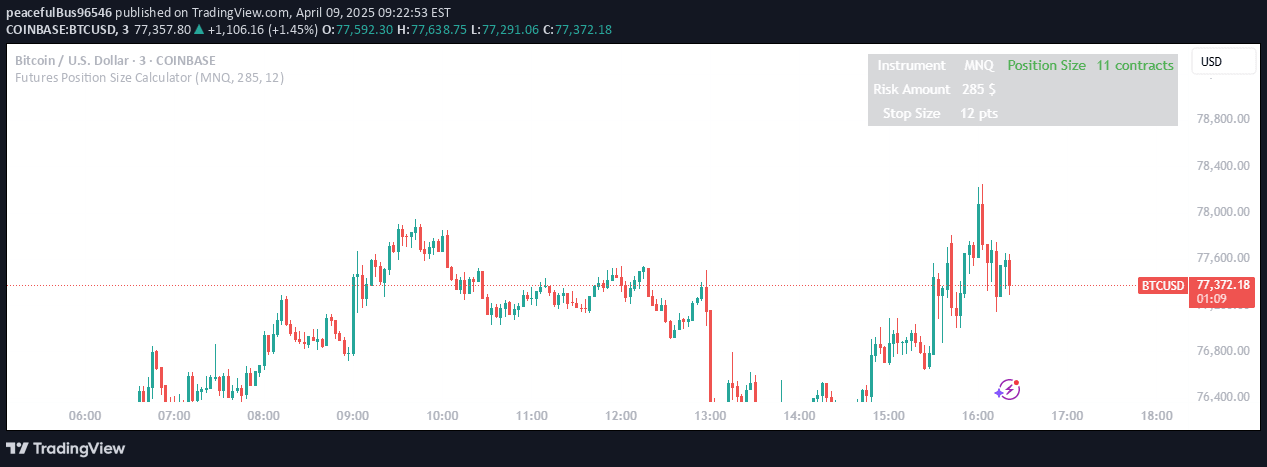
An advanced trading tool that calculates and displays average entry prices across multiple positions, helping traders track and visualize their investment strategy with precision.
Explore complementary indicator rolesHow it works
The Average Entry Price Calculator allows traders to input multiple position details, including entry price and amount in USDT. It automatically computes the weighted average entry price across these positions, displaying a clear horizontal line on the trading chart to represent this key metric.
As traders enter different positions, the indicator dynamically updates the average entry price line, showing individual entry points as separate lines. This visualization helps traders understand their overall position's cost basis and provides a real-time reference point for potential profit or loss calculations.
Why it may be useful
Tracking average entry prices is crucial for effective risk management and strategic decision-making in trading. By providing a clear visual representation of entry points, traders can make more informed choices about when to enter, exit, or adjust their positions based on their overall investment strategy.
The indicator eliminates the complexity of manual calculations, offering an intuitive tool that helps traders maintain a comprehensive view of their investment performance. It supports various trading approaches, from dollar-cost averaging to multi-entry strategies, making it valuable for traders across different experience levels.
When to explore it
The Average Entry Price Calculator is most effective during volatile market conditions where multiple entries are common. It's particularly useful for traders implementing dollar-cost averaging strategies, where positions are accumulated at different price points over time.
Traders can leverage this tool during trending markets, consolidation periods, and when managing complex multi-position trades. It becomes especially valuable when tracking long-term investments or when strategically averaging into or out of positions across different market cycles.
Keep exploring
What we’ve verified
Access, alerts and repainting behaviour have not been independently verified for this indicator. Check the creator’s current publication and settings.
General descriptions and classifications are recovered research. Verified details above identify the specific checks we have completed. Check the creator’s current publication for later changes.