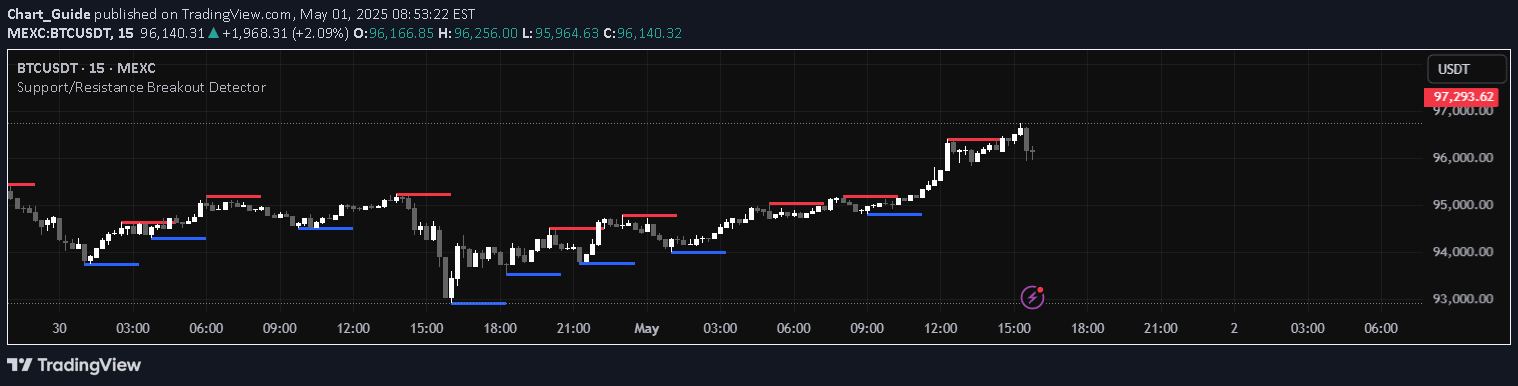
A trading signal that identifies potential support and resistance levels using a weighted average middle line, particularly effective on BTCUSDT for generating buy or sell signals.
Explore complementary indicator rolesHow it works
The indicator operates by calculating a weighted average middle line based on price action and market dynamics. It analyzes price movements relative to this central line to determine potential trading opportunities.
By tracking the relationship between current price and the middle line, the signal generates buy or sell indications when price crosses or approaches the line. This method helps traders identify potential entry and exit points by understanding the asset's current momentum and directional bias.
Why it may be useful
This signal provides traders with a systematic approach to understanding market dynamics and potential price movements. It offers a visual representation of market trends and momentum, helping traders make more informed decisions.
By focusing on the relationship between price and a weighted average line, traders can gain insights into potential trend reversals, support and resistance levels, and overall market sentiment. This approach reduces emotional trading and provides a structured method for analyzing market conditions.
When to explore it
The signal is most effective when trading BTCUSDT due to its unique price behavior and volatility. It works best in markets with clear trending characteristics and sufficient price movement.
Traders should utilize this signal during periods of stable market conditions and avoid using it during extreme market volatility or during major news events. Combining this signal with other technical analysis tools and risk management strategies can enhance its effectiveness and reliability.
Keep exploring
What we’ve verified
Access, alerts and repainting behaviour have not been independently verified for this indicator. Check the creator’s current publication and settings.
General descriptions and classifications are recovered research. Verified details above identify the specific checks we have completed. Check the creator’s current publication for later changes.