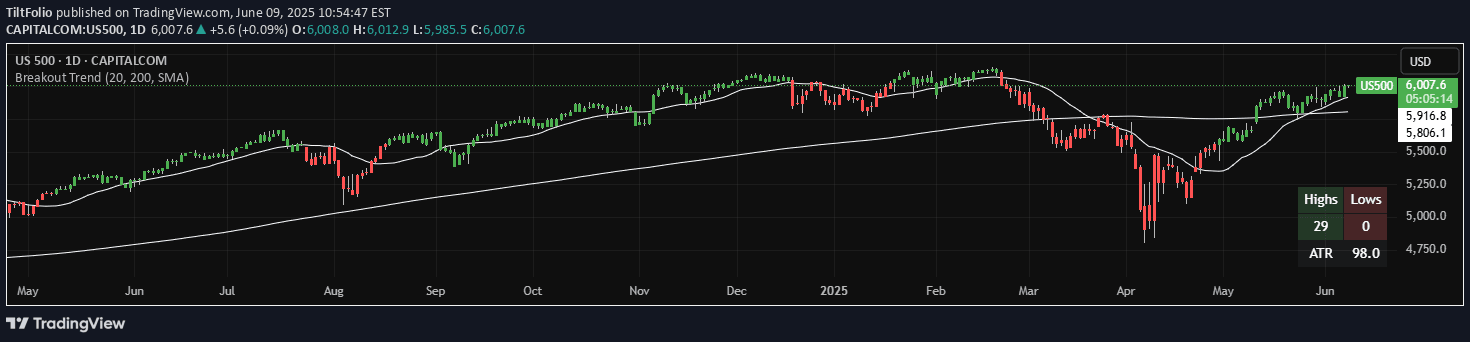
A dual channel breakout indicator using short-term and long-term moving averages to plot bands and identify potential trading opportunities across different market conditions.
Explore complementary indicator rolesHow it works
The dual channel breakout script calculates short-term and long-term moving averages using a modified typical price calculation. It creates upper, lower, and middle bands by analyzing price movements and applying different moving average techniques, including simple and exponential moving averages.
The indicator plots these bands on the chart, with short-term bands representing immediate price dynamics and long-term EMAs providing a smoother trend perspective. When short-term bands cross long-term EMAs, the script highlights potential breakout opportunities, helping traders identify potential entry and exit points.
Why it may be useful
This indicator provides traders with a comprehensive view of market dynamics by integrating multiple timeframe analyses into a single visual representation. By combining short-term and long-term moving averages, it offers insights into both immediate price movements and underlying trend directions, which can help traders make more informed decisions.
The dual channel breakout approach allows traders to understand market volatility, trend strength, and potential reversal points. Its flexible design enables users to adapt the indicator to different trading styles and market conditions, making it a versatile tool for technical analysis.
When to explore it
The dual channel breakout indicator works best in markets with clear trending characteristics, where price movements show consistent directional momentum. It is particularly effective in liquid markets with sufficient price data to generate reliable moving average calculations, such as major forex pairs, stock indices, and large-cap stocks.
Traders should use this indicator in conjunction with other technical analysis tools to confirm signals and reduce false breakout risks. It is most suitable during periods of stable market conditions and can be adjusted by modifying the short-term and long-term length parameters to match specific asset characteristics.
Keep exploring
What we’ve verified
Access, alerts and repainting behaviour have not been independently verified for this indicator. Check the creator’s current publication and settings.
General descriptions and classifications are recovered research. Verified details above identify the specific checks we have completed. Check the creator’s current publication for later changes.