
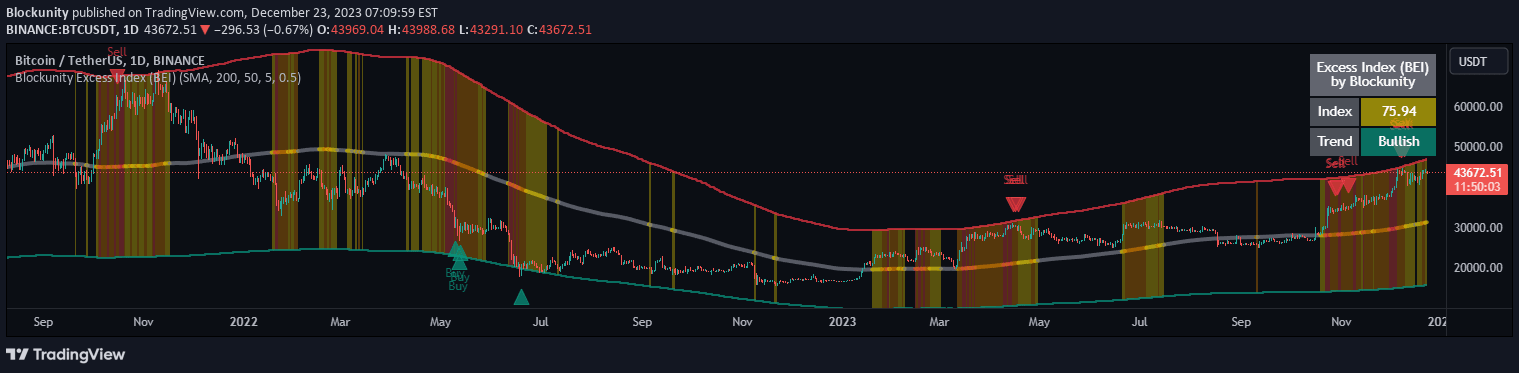
A dynamic trading indicator measuring price deviations from a moving average to identify potential market reversals and trend changes across different timeframes and assets.
Explore complementary indicator rolesHow it works
The Excess Index calculates price deviations from a customizable moving average using a specific mathematical formula that normalizes the absolute distance between price and the average. By comparing the current price deviation against historical price deviation ranges, it generates an indexed value that indicates market conditions.
The indicator uses different moving average types like SMA, EMA, WMA, and PCMA, allowing traders to adapt the calculation method to their preferred analysis approach. Signals are generated based on specific conditions involving the index value, price position relative to the moving average, and recent price movements.
Why it may be useful
The Excess Index provides traders with a flexible tool for understanding market dynamics by quantifying price behavior around a central moving average. It helps identify potential trend reversals and market excess zones, offering insights into potential trading opportunities across different market conditions.
By allowing customization of moving average types and parameters, the indicator can be tailored to various trading styles and asset classes. The visual representation of price deviations through color-coded zones and signal triangles makes it easier for traders to quickly interpret market conditions.
When to explore it
The Excess Index works best in markets with clear trending or ranging characteristics, where price deviations from an average can signal potential reversals or continuation patterns. It is particularly useful in volatile markets where understanding price momentum and potential trend changes is crucial for making informed trading decisions.
Traders can optimize the indicator's performance by experimenting with different moving average types, lookback periods, and coefficient settings to match the specific characteristics of the traded asset. It is most effective when used in conjunction with other technical analysis tools to confirm signals and reduce false positives.
Keep exploring
What we’ve verified
Access, alerts and repainting behaviour have not been independently verified for this indicator. Check the creator’s current publication and settings.
General descriptions and classifications are recovered research. Verified details above identify the specific checks we have completed. Check the creator’s current publication for later changes.


