
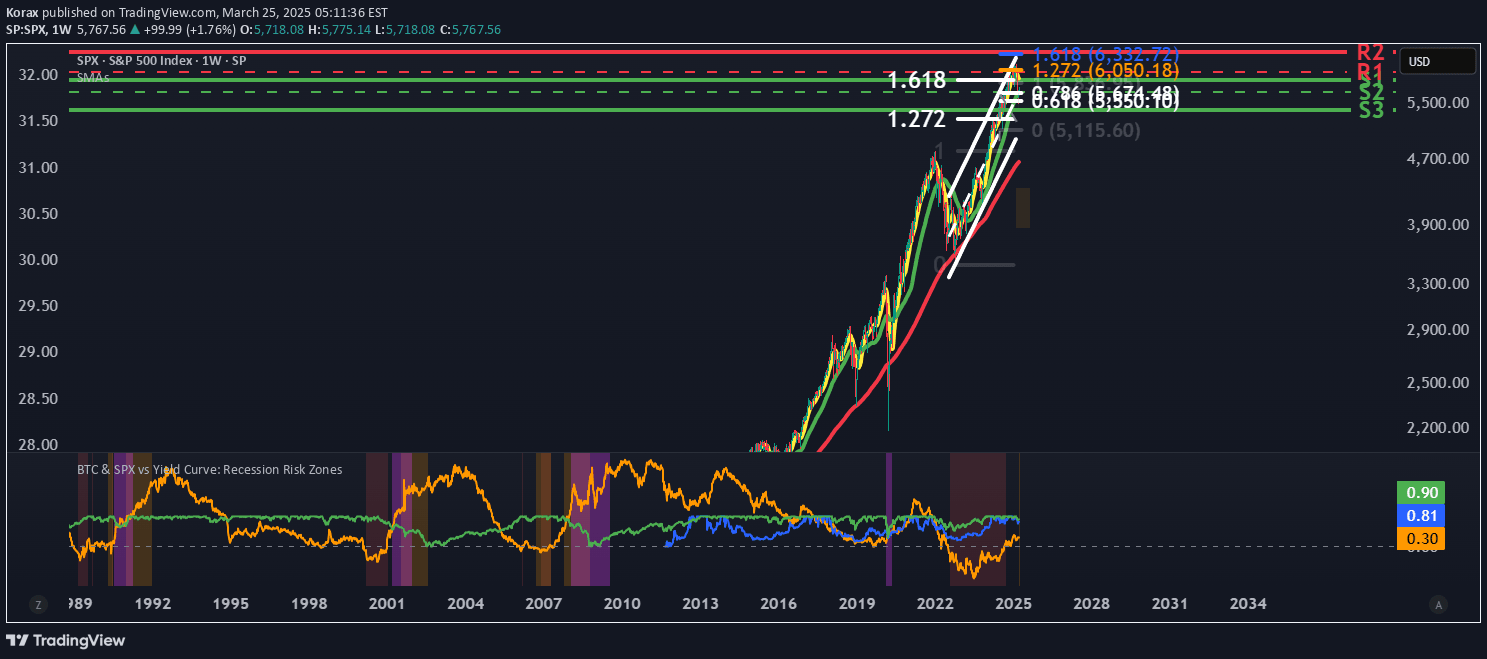
A macro tool tracking Bitcoin and S&P 500 performance against yield curve inversions to identify potential economic stress and recession risk zones.
Explore complementary indicator rolesHow it works
The tool analyzes the 10-year and 2-year Treasury yield spread to detect potential economic warning signals. When the yield curve inverts, it creates color-coded zones representing different stages of recession risk, with red indicating initial inversion, yellow showing projected recession potential, and orange marking an active risk window.
By normalizing the prices of Bitcoin and the S&P 500, the tool allows traders to visualize how these assets perform during periods of economic uncertainty. The color-coded system provides a clear visual representation of macro economic pressures and potential market stress zones.
Why it may be useful
Understanding macro economic signals is crucial for traders seeking to protect their investments during potential market downturns. By tracking yield curve inversions, traders can gain insights into broader economic trends that might impact asset performance across different markets.
The tool provides a unique perspective on how Bitcoin and traditional stock markets react to economic stress, helping investors make more informed decisions about portfolio allocation and risk management during potentially turbulent economic periods.
When to explore it
This signal is most effective during periods of economic uncertainty and potential market transitions. Traders should pay close attention when the yield curve shows signs of inversion or when the color-coded zones shift from green to red or yellow.
It is particularly useful for swing traders and long-term investors who want to understand broader economic cycles and potential market risks. The tool can help identify periods when traditional investment strategies might need adjustment in response to macroeconomic pressures.
Keep exploring
What we’ve verified
Access, alerts and repainting behaviour have not been independently verified for this indicator. Check the creator’s current publication and settings.
General descriptions and classifications are recovered research. Verified details above identify the specific checks we have completed. Check the creator’s current publication for later changes.


