
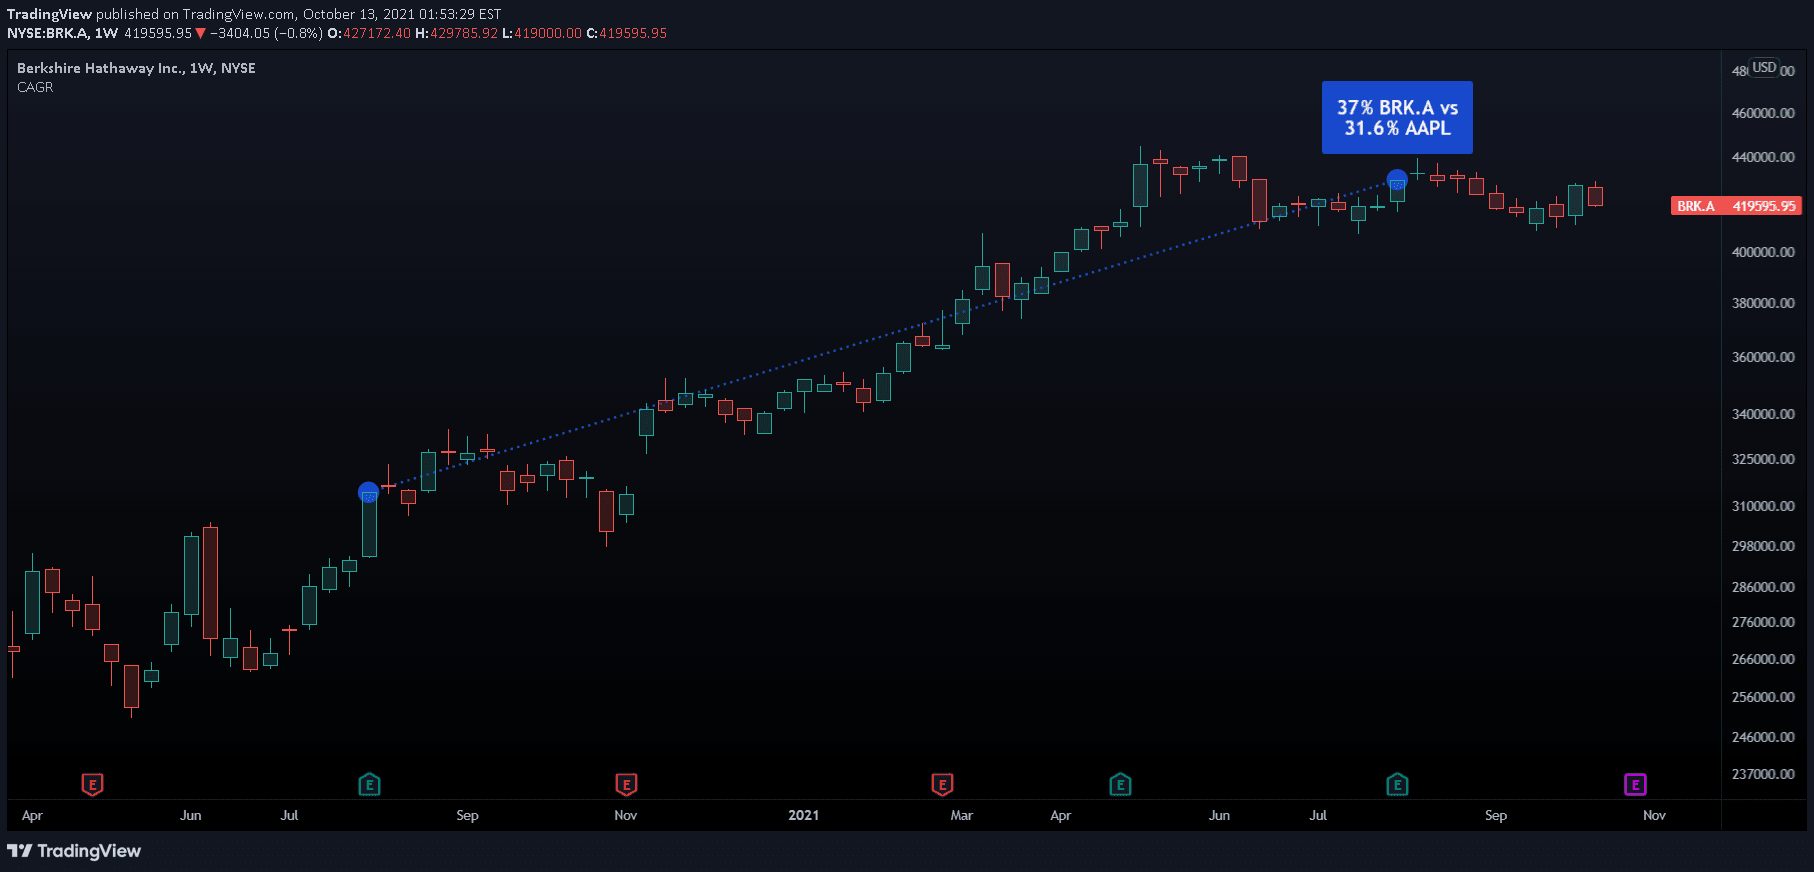
A Pine Script tool for calculating Compound Annual Growth Rate (CAGR) by interactively selecting two time points on a chart, providing an annualized performance metric.
Explore complementary indicator rolesHow it works
The script enables users to select two points on a chart by clicking, automatically identifying the close values at those points. It calculates the Compound Annual Growth Rate by comparing these points, considering the time difference between them.
The tool generates a line connecting the selected points and displays the CAGR value. Users can customize the line's color and width based on the growth rate's direction. The script also offers an optional comparison feature with another financial symbol's performance, providing additional context for the calculated growth rate
Why it may be useful
CAGR provides traders with a standardized method to evaluate investment performance across different time periods. It helps investors understand the consistent annual return of an investment, accounting for compounding effects. By annualizing returns, traders can make more informed comparisons between different assets or investment strategies.
The interactive selection method allows for flexible analysis, enabling users to examine specific market segments or trading periods. This tool simplifies complex performance calculations and offers a quick, visual representation of investment growth
When to explore it
This CAGR calculator is most effective when comparing long-term investment performance across different assets or time periods. It works best with financial instruments that have sufficient historical data to generate meaningful results.
Traders can use it to assess portfolio performance, evaluate trading strategies, and compare different market sectors. The tool is particularly useful for analyzing stocks, ETFs, and other financial instruments with consistent trading data. Investors should ensure the selected time points are at least one day apart for accurate calculations
Keep exploring
What we’ve verified
Access, alerts and repainting behaviour have not been independently verified for this indicator. Check the creator’s current publication and settings.
General descriptions and classifications are recovered research. Verified details above identify the specific checks we have completed. Check the creator’s current publication for later changes.


