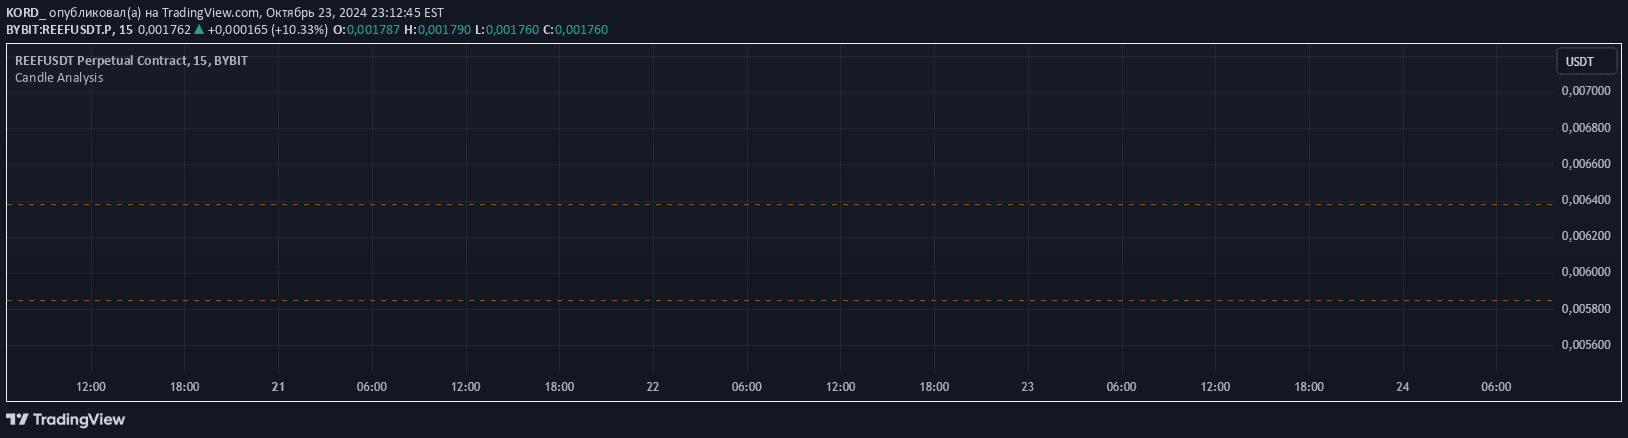
A candle analysis tool that labels price movements as bullish or bearish based on closing price relationships, helping traders quickly identify momentum shifts and potential trend changes.
Explore complementary indicator rolesHow it works
The Candle Analysis Bias indicator evaluates price movement by comparing the current candle's closing price to the previous candle's high and low. When a candle closes above the previous candle's high, it receives a bullish label, signaling potential upward momentum. Conversely, when a candle closes below the previous candle's low, it receives a bearish label, indicating potential downward pressure.
The indicator employs a systematic approach to labeling, ensuring that only completed candles are analyzed to prevent premature signals. By using color-coded labels with customizable appearance, traders can quickly visualize potential trend shifts and momentum changes across different timeframes.
Why it may be useful
The Candle Analysis Bias indicator provides traders with a quick and intuitive method to assess market sentiment and potential price direction. By offering visual cues through color-coded labels, the indicator helps traders rapidly identify momentum shifts without requiring complex calculations or extensive technical analysis experience.
This tool is particularly valuable for traders seeking to understand short-term price dynamics and potential trend reversals. Its simplicity and customization options make it adaptable to various trading styles and market conditions, enabling traders to make more informed decisions based on clear, visual information.
When to explore it
The Candle Analysis Bias indicator is most effective in markets with clear directional movements and when used in conjunction with other technical analysis tools. It works particularly well in trending markets where momentum changes are more predictable and significant, such as forex, stocks, and cryptocurrency trading.
Traders should use this indicator during periods of active trading and when seeking to confirm potential trend reversals or continuations. It is especially useful for short to medium-term trading strategies, providing quick insights into market sentiment and potential price movement direction.
Keep exploring
What we’ve verified
Access, alerts and repainting behaviour have not been independently verified for this indicator. Check the creator’s current publication and settings.
General descriptions and classifications are recovered research. Verified details above identify the specific checks we have completed. Check the creator’s current publication for later changes.