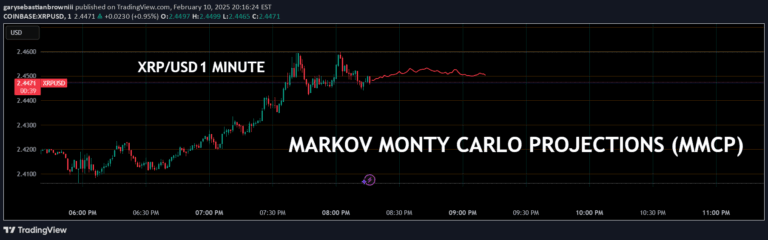
A TradingView script that calculates price movement probabilities by analyzing past candles and volatility, providing traders with potential directional insights across multiple timeframes.
Explore complementary indicator rolesHow it works
The script analyzes the last 30 candles by default to calculate the probability of upward and downward price movements. It examines historical price patterns and compares current market conditions to past trends. The algorithm tracks price changes and computes statistical probabilities for potential future movements.
It uses a lookback period to assess historical price behavior and determines the likelihood of price increases or decreases. Volatility is measured using the Average True Range (ATR) indicator to provide additional context. The script generates color-coded visualizations to represent these probabilities. Multiple timeframes from 1 minute to 1 week are analyzed simultaneously
Why it may be useful
Traders can benefit from understanding potential price movement probabilities as it provides a data-driven approach to market analysis. The script offers insights into market sentiment and potential trend directions based on historical data. By presenting probabilities across different timeframes, traders can make more informed decisions about market entry and exit points.
The color-coded dashboard makes complex statistical analysis more accessible and visually interpretable. Incorporating volatility measurements helps traders assess market risk and potential price fluctuations. The script transforms raw historical data into actionable trading insights. It serves as a complementary tool for technical analysis strategies
When to explore it
This script works best in markets with clear historical price patterns and consistent trading behavior. It is most effective for traders seeking statistical insights across multiple timeframes. The indicator is particularly useful during periods of moderate market volatility where historical trends can provide meaningful predictions.
Traders should use this tool in conjunction with other technical and fundamental analysis methods. It is most reliable when applied to liquid markets with sufficient trading volume. The script can help identify potential trend reversals and continuation patterns. Ideal for traders who want a data-driven approach to market analysis
Keep exploring
What we’ve verified
Access, alerts and repainting behaviour have not been independently verified for this indicator. Check the creator’s current publication and settings.
General descriptions and classifications are recovered research. Verified details above identify the specific checks we have completed. Check the creator’s current publication for later changes.