
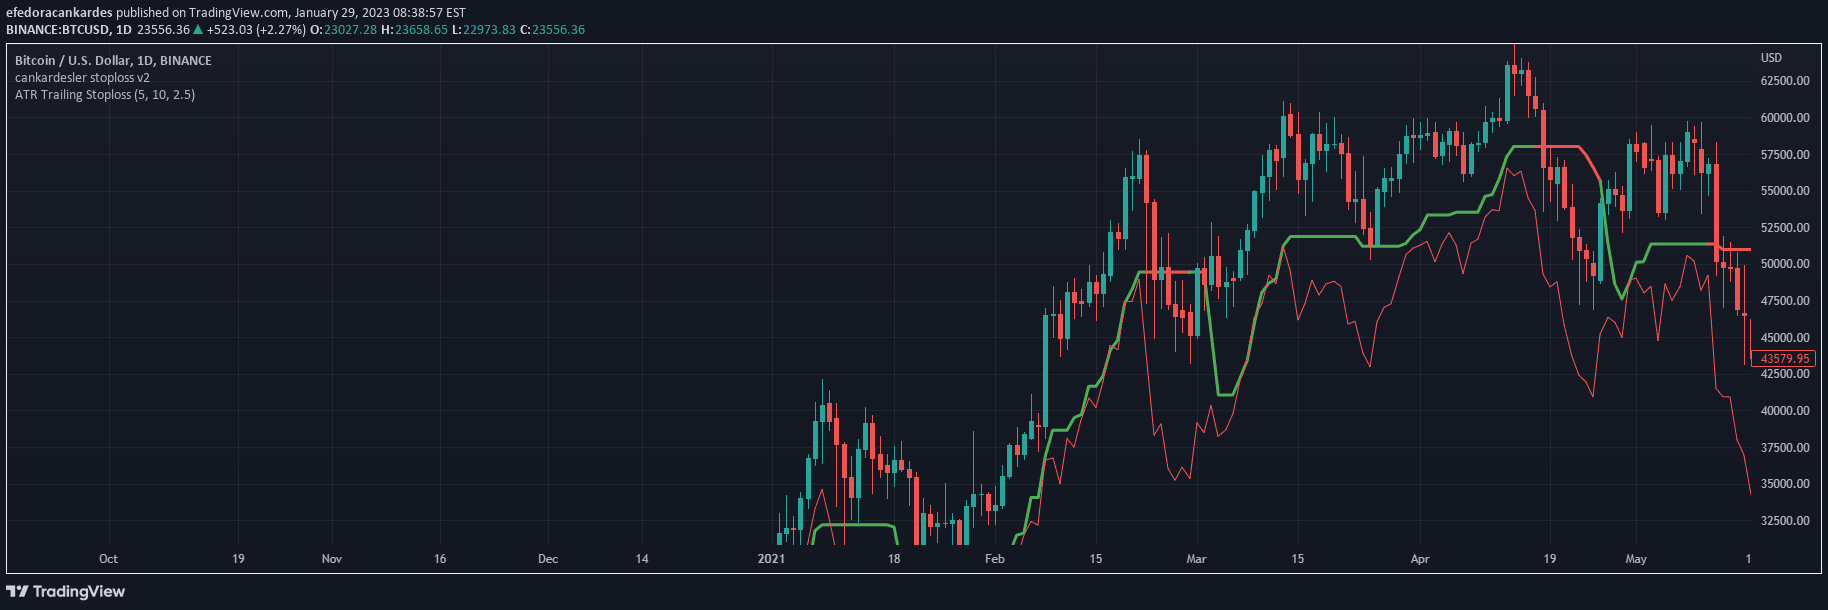
A dynamic stoploss strategy that calculates standard deviation from recent price spikes to filter out false market trends and protect against unexpected price movements.
Explore complementary indicator rolesHow it works
The stoploss strategy begins by analyzing recent price spikes and calculating their average value. It then computes the standard deviation of these spikes to understand market volatility patterns. By integrating this deviation into the traditional stoploss formula of price plus two Average True Range (ATR), traders create a more adaptive and robust stop placement mechanism.
This approach allows for a more nuanced stoploss calculation that accounts for market volatility. The method dynamically adjusts the stoploss level by incorporating the statistical spread of recent price movements, which helps traders avoid being prematurely stopped out by temporary market fluctuations.
Why it may be useful
Traditional stoploss strategies often fail to account for market volatility, leading to premature trade exits during temporary price fluctuations. This advanced approach provides traders with a more intelligent risk management tool that adapts to changing market conditions. By understanding and integrating the statistical variation of recent price spikes, traders can protect their positions more effectively.
The strategy's significance lies in its ability to reduce false market signals and provide a more robust mechanism for managing trading risk. It helps traders maintain positions during normal market volatility while still providing protection against significant adverse price movements.
When to explore it
This stoploss strategy is most effective in markets experiencing moderate to high volatility, where traditional fixed stoploss methods might prove ineffective. It works particularly well in trading environments with frequent price spikes and sudden market movements, such as cryptocurrency, forex, and certain stock markets. Traders should consider this approach when they want a more adaptive risk management technique.
The method is especially useful during periods of market uncertainty or when trading instruments known for erratic price behavior. It provides an additional layer of protection by filtering out noise and focusing on more significant price trends, making it valuable for traders seeking a more sophisticated approach to managing potential losses.
Keep exploring
What we’ve verified
Access, alerts and repainting behaviour have not been independently verified for this indicator. Check the creator’s current publication and settings.
General descriptions and classifications are recovered research. Verified details above identify the specific checks we have completed. Check the creator’s current publication for later changes.


