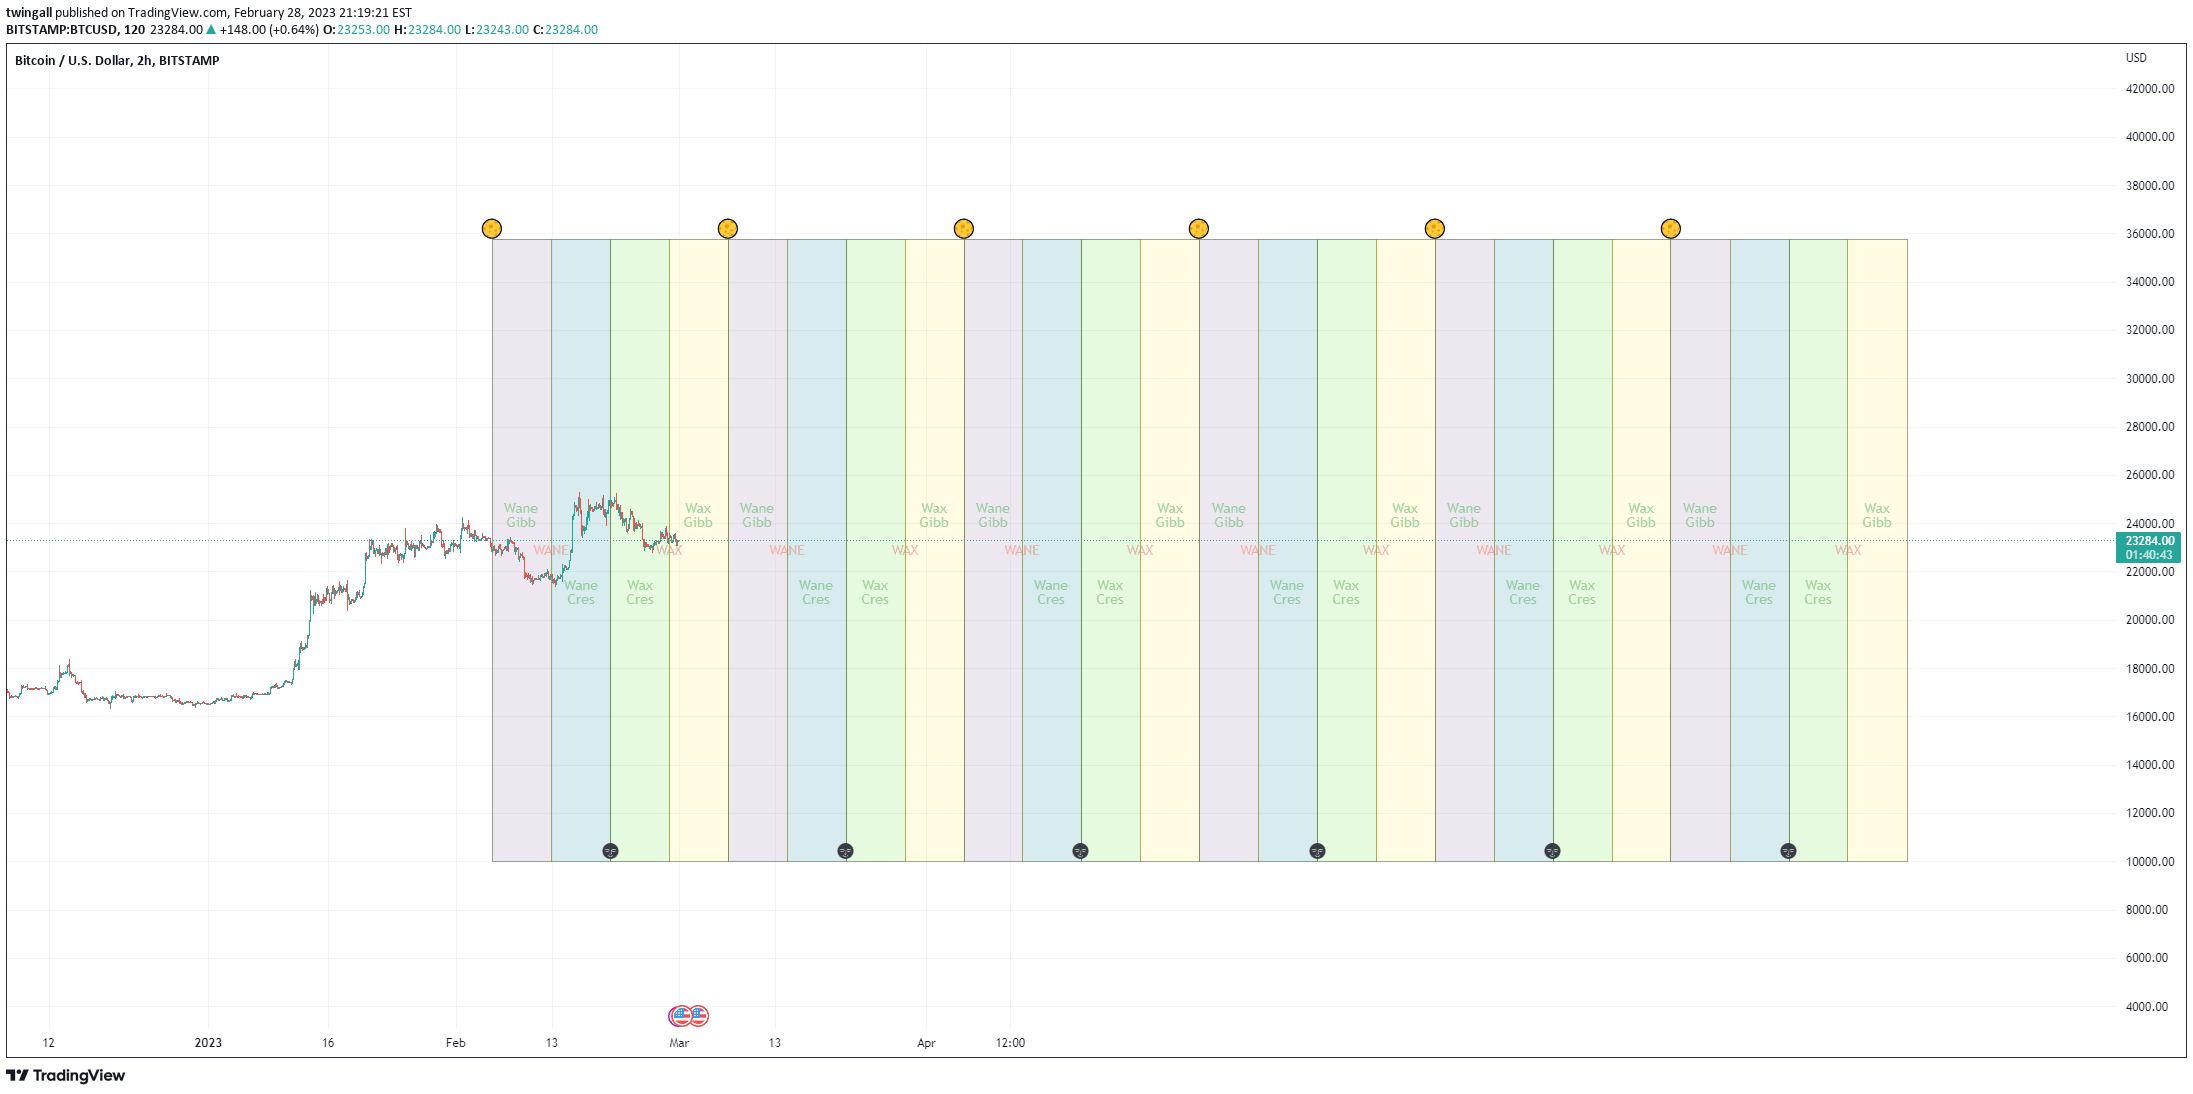
A trading tool that overlays previous session data onto current charts, helping traders visualize potential market liquidity, price gaps, and equilibrium points across different timeframes.
Explore complementary indicator rolesHow it works
The indicator uses Simple Moving Average (SMA) with a length of 1 to plot data points without smoothing, allowing precise visualization of historical price data. For intraday charts, it calculates data offset based on electronic trading hours (1380 minutes) or regular trading hours (405 minutes), ensuring accurate data correlation.
For daily charts, the tool plots historical data ranges at 20, 40, and 60 bars forward, enabling traders to identify potential market liquidity zones and equilibrium points. By offsetting historical data, traders can gain insights into possible future market movements and structure shifts.
Why it may be useful
This indicator provides traders with a unique perspective on market dynamics by visualizing historical price data in relation to current market conditions. It helps traders understand potential liquidity zones, price gaps, and market equilibrium points, which can be crucial for making informed trading decisions.
By offering a comprehensive view of price movement across different timeframes, the tool allows traders to anticipate potential market behavior and identify strategic entry and exit points. This approach enhances traders' ability to understand market structure and make more precise trading choices.
When to explore it
The indicator is most effective for traders seeking to understand market structure and potential future price movements across various timeframes. It works best for electronic and regular trading hours, providing insights into market liquidity and equilibrium points for both intraday and daily charts.
Traders can utilize this tool when they want to analyze historical price data in context, identify potential market rebalancing zones, and gain a deeper understanding of market dynamics. It is particularly useful for traders who want to visualize potential future market behavior based on historical price patterns.
Keep exploring
What we’ve verified
Access, alerts and repainting behaviour have not been independently verified for this indicator. Check the creator’s current publication and settings.
General descriptions and classifications are recovered research. Verified details above identify the specific checks we have completed. Check the creator’s current publication for later changes.