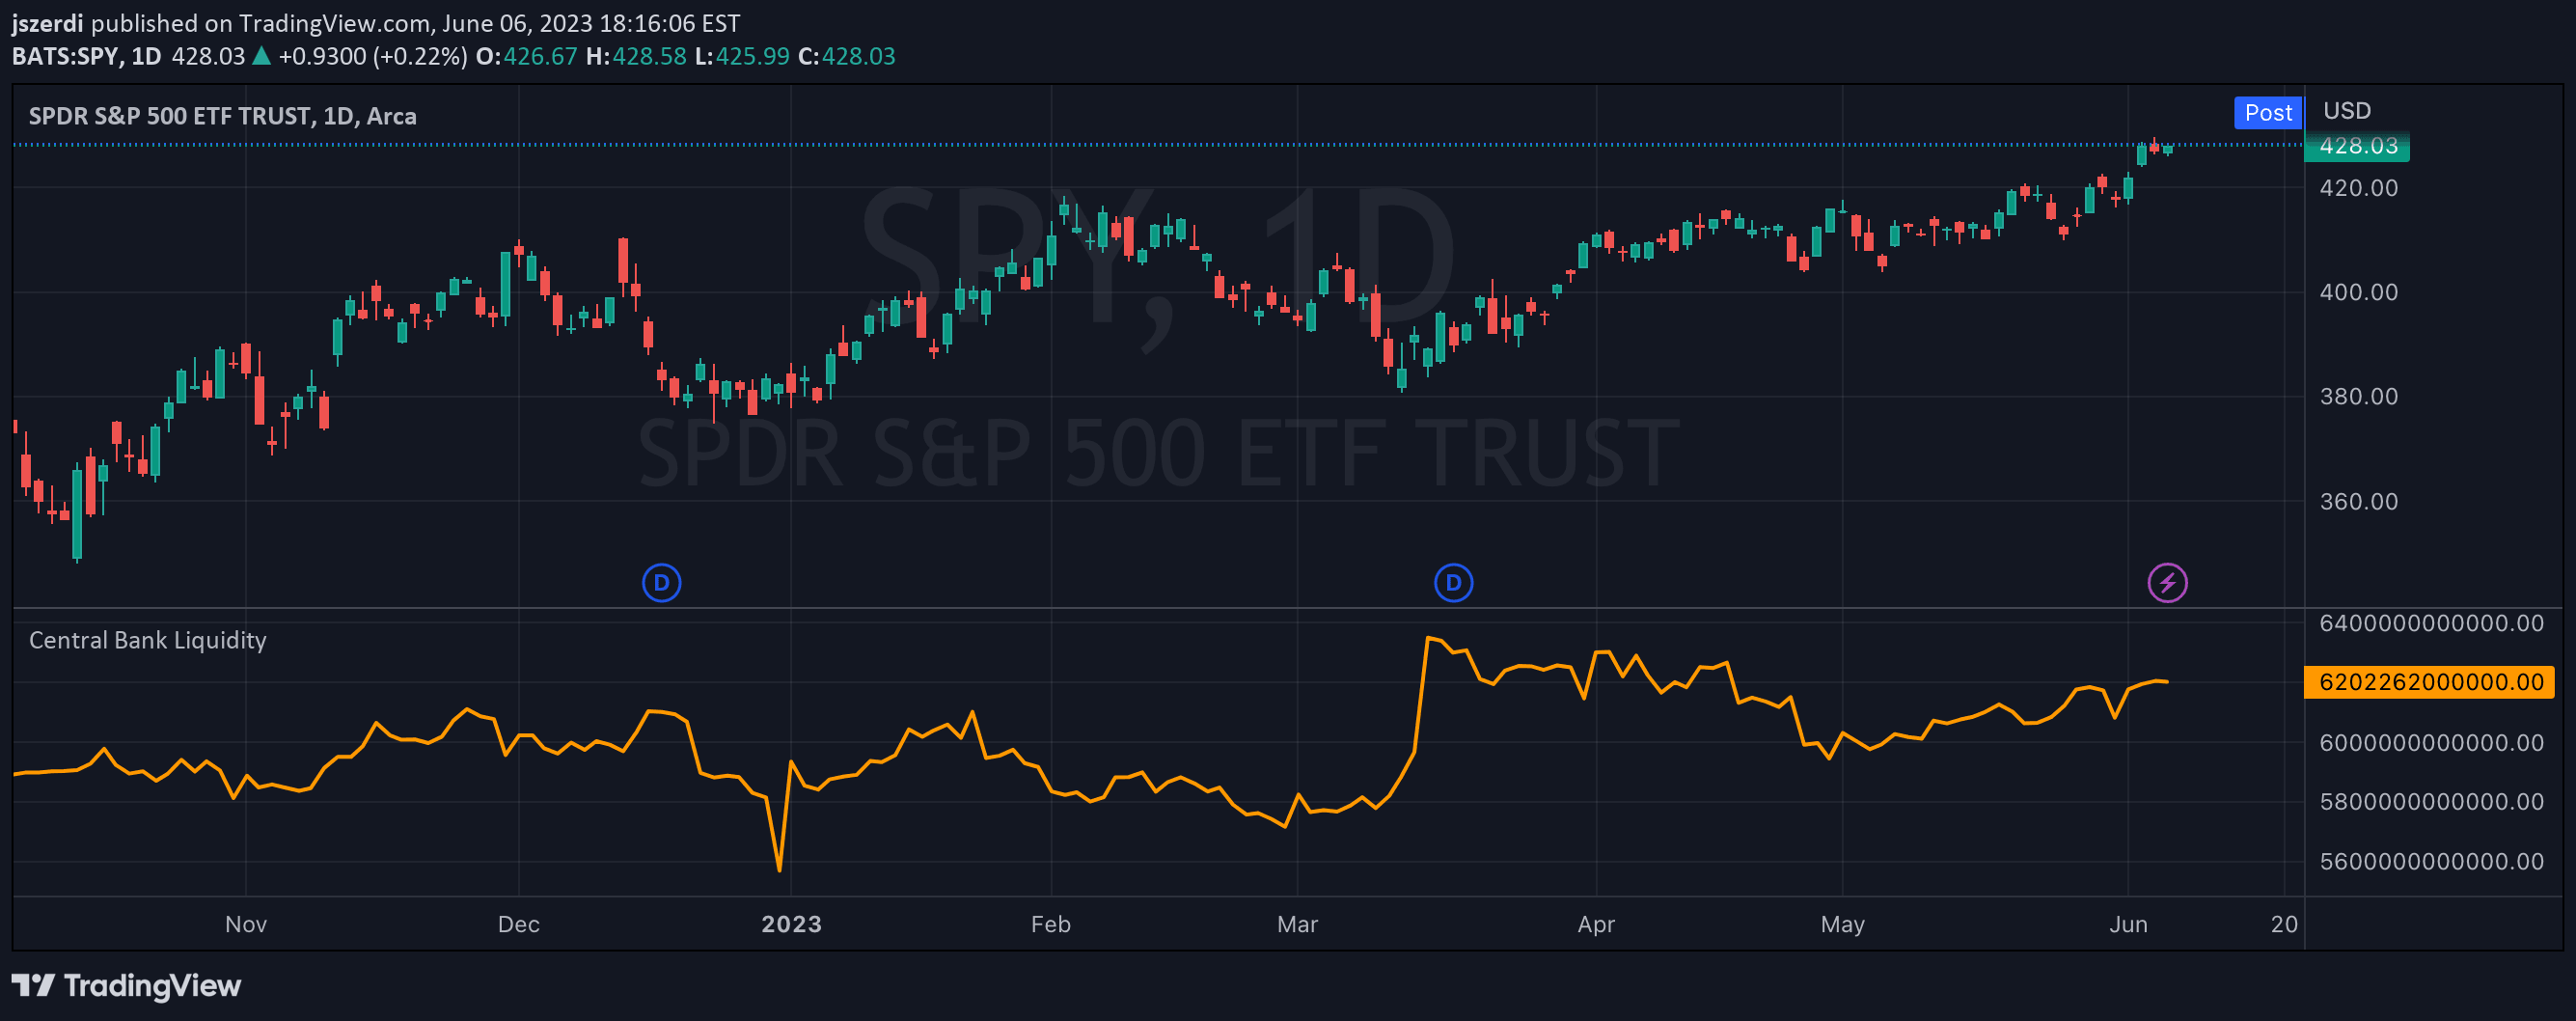
Central Bank Liquidity tracks year-over-year changes in monetary supply, indicating market conditions and potential asset allocation strategies based on liquidity trends.
Explore complementary indicator rolesHow it works
The Central Bank Liquidity indicator measures the percent change in monetary supply by calculating the difference between total Federal Reserve Bank assets, overnight reverse repurchase agreements, and the Treasury General Account. It provides a year-over-year percentage change that reveals the rate of liquidity expansion or contraction in the financial system.
Traders analyze this metric by observing its movement above or below the zero line, which indicates whether liquidity is being added or removed from the market. When the indicator transitions from negative to positive, it signals a potential market bottom and suggests changing asset allocation strategies.
Why it may be useful
Central Bank Liquidity is crucial for understanding broader economic conditions and market sentiment, as it directly reflects monetary policy and potential investment opportunities. By tracking liquidity changes, investors can anticipate shifts in market dynamics and make more informed decisions about asset allocation.
The indicator provides insights into central bank actions and their potential impact on financial markets, helping traders identify periods of potential market expansion or contraction. Understanding these liquidity trends can help investors position their portfolios more strategically in response to changing economic conditions.
When to explore it
This indicator is most effective during periods of significant monetary policy changes or economic transitions, where central bank actions can substantially impact market conditions. Investors should pay close attention when the liquidity metric is showing notable shifts or crossing the zero line.
The Central Bank Liquidity indicator works best for swing trading and longer-term investment strategies, providing broader market insights rather than short-term trading signals. It is particularly valuable during economic cycles, central bank policy shifts, and periods of potential market bottoming or top formation.
Keep exploring
What we’ve verified
Access, alerts and repainting behaviour have not been independently verified for this indicator. Check the creator’s current publication and settings.
General descriptions and classifications are recovered research. Verified details above identify the specific checks we have completed. Check the creator’s current publication for later changes.