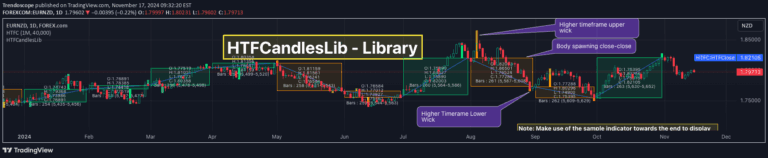
A chart pattern library that identifies and visualizes specific trading patterns using zigzag pivot points, helping traders detect and analyze complex market structures.
Explore complementary indicator rolesHow it works
The chartpatterns library uses a zigzag object containing pivot points to systematically scan and identify specific market patterns. It employs advanced algorithms to compare slope, retracement ratios, and bar characteristics against predefined pattern properties.
By analyzing multiple pivot points (5-6), the library can detect complex chart formations with customizable error thresholds. Users can set parameters like offset, error ratio, and flat ratio to fine-tune pattern detection. The library then draws these patterns on the chart, highlighting trend lines and pivot points for visual analysis
Why it may be useful
Chart pattern recognition is crucial for traders seeking to understand market psychology and potential price movements. This library automates the complex process of identifying intricate chart formations, reducing human error and subjective interpretation.
By providing systematic pattern detection, traders can quickly spot potential trend reversals, continuation patterns, and trading opportunities. The customizable nature of the library allows adaptation to different trading styles and market conditions. Visual representation of patterns helps traders make more informed decisions based on historical price behavior
When to explore it
This pattern recognition library is most effective in markets with clear trend structures and sufficient price history. It works best in liquid markets like forex, stocks, and major commodities where price movements tend to form recognizable patterns.
Traders should use it during periods of established trends and when market volatility allows for clear pivot point formation. It is particularly useful for swing traders and technical analysts who rely on pattern-based strategies. The library's flexibility makes it suitable for different timeframes and market conditions
Keep exploring
What we’ve verified
Access, alerts and repainting behaviour have not been independently verified for this indicator. Check the creator’s current publication and settings.
General descriptions and classifications are recovered research. Verified details above identify the specific checks we have completed. Check the creator’s current publication for later changes.