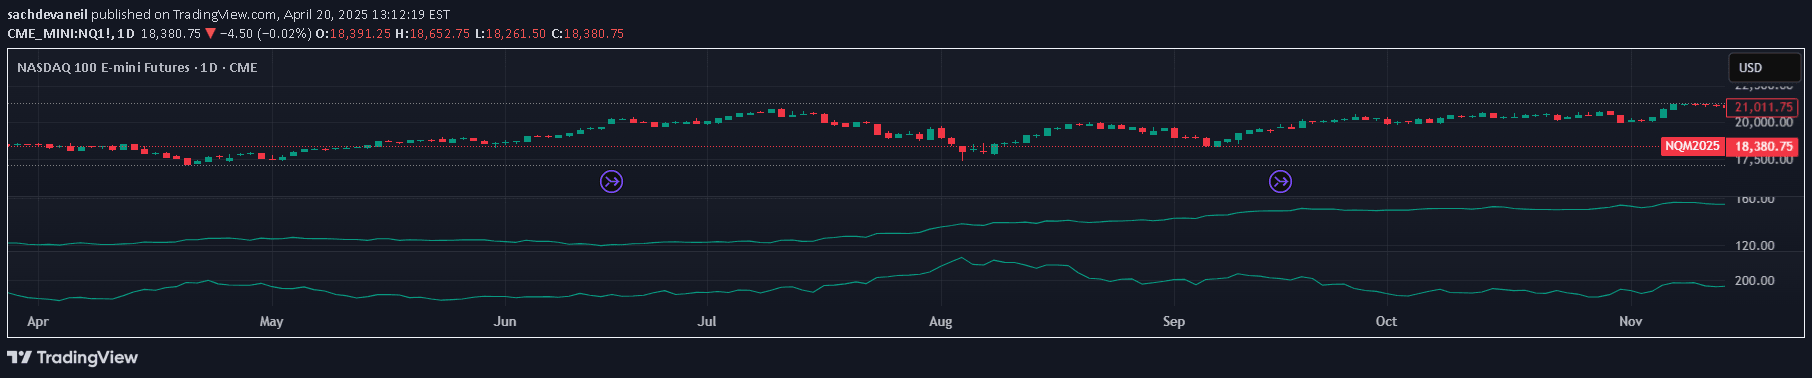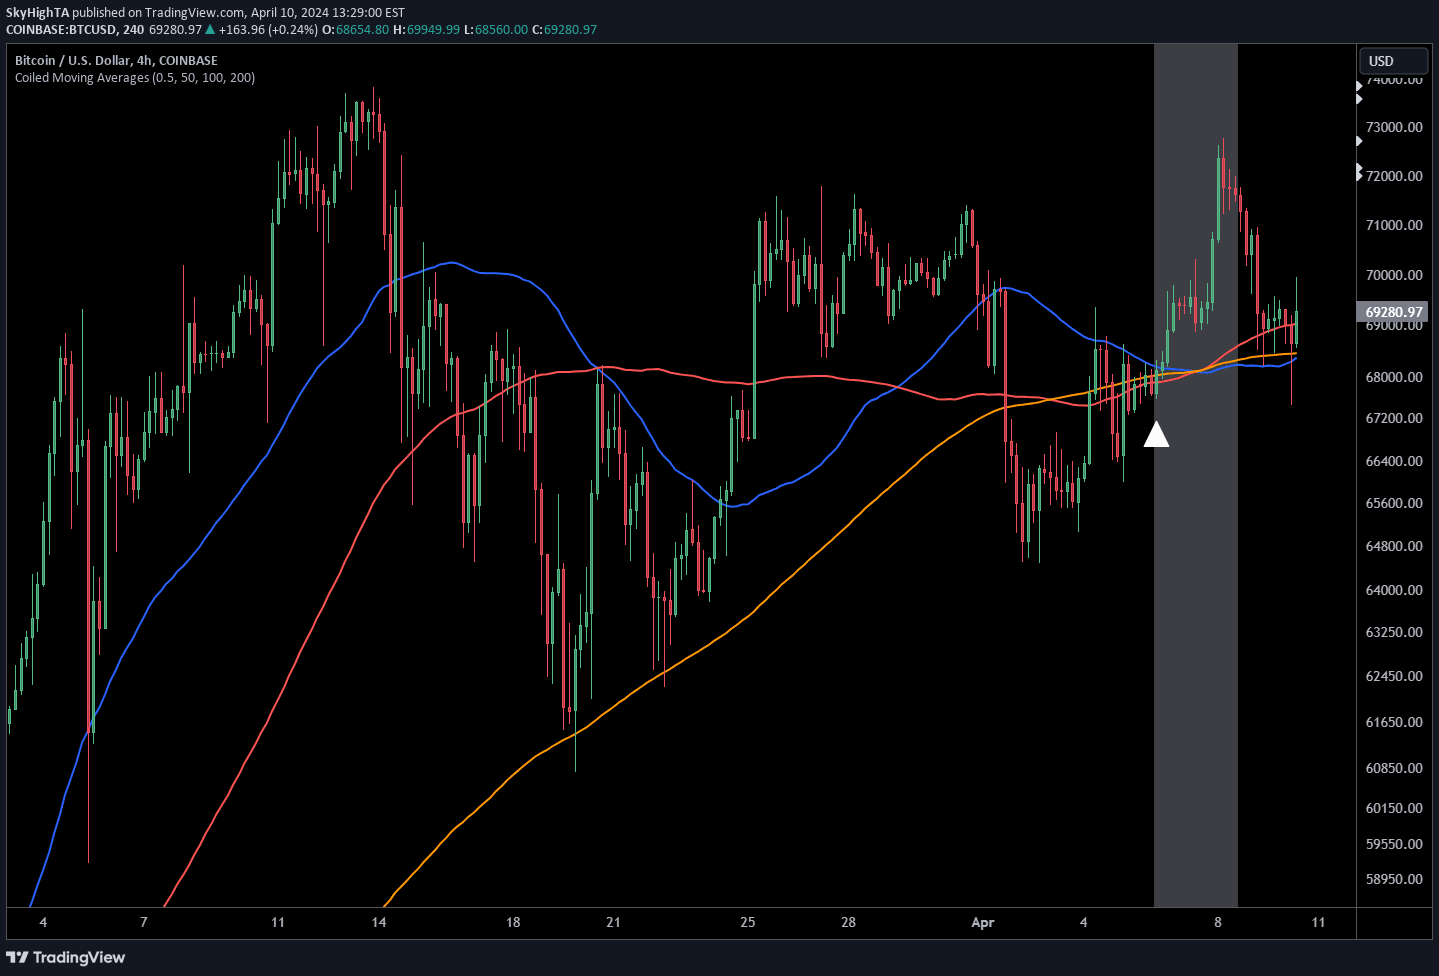
A trading indicator that detects convergence of moving averages, signaling potential volatility expansion and significant price movements through MA coiling techniques.
Explore complementary indicator rolesHow it works
The indicator analyzes three moving averages and calculates their percentage differences to determine when they become coiled. When the percent difference between moving averages falls below a specified tolerance level, it signals a potential volatility contraction. This coiling represents a compression of price movement, where the moving averages converge tightly around each other.
The system allows customization of moving average types, lengths, and coil tolerance percentage. It also provides visual indicators like background color changes and directional arrows to highlight when moving averages have become coiled. These features help traders quickly identify potential volatility expansion scenarios across different timeframes and market conditions.
Why it may be useful
This indicator is valuable because it provides traders with an early warning system for potential significant price movements. By detecting volatility contraction, traders can anticipate potential breakout scenarios before they occur. The unique approach of measuring moving average convergence offers insights beyond traditional crossover or price-to-MA distance indicators.
The additional features like directional arrows and bullish/bearish MA alignment help traders assess potential price movement direction. This can improve trade entry timing and provide a probabilistic view of upcoming market volatility, enabling more strategic decision-making across different trading styles and timeframes.
When to explore it
The moving average coiling indicator works best in markets experiencing periods of consolidation or range-bound trading. Traders should look for situations where price movement has been relatively constrained and moving averages are converging tightly. It is particularly effective when used across multiple timeframes to confirm potential volatility expansion signals.
Ideal application includes analyzing stocks, forex, cryptocurrencies, and futures markets with sufficient liquidity. Traders should combine this indicator with other technical analysis tools to validate signals and reduce false positives. Experimenting with different moving average types, lengths, and coil tolerance settings can help optimize the indicator's performance for specific market conditions.
Keep exploring
What we’ve verified
Access, alerts and repainting behaviour have not been independently verified for this indicator. Check the creator’s current publication and settings.
General descriptions and classifications are recovered research. Verified details above identify the specific checks we have completed. Check the creator’s current publication for later changes.