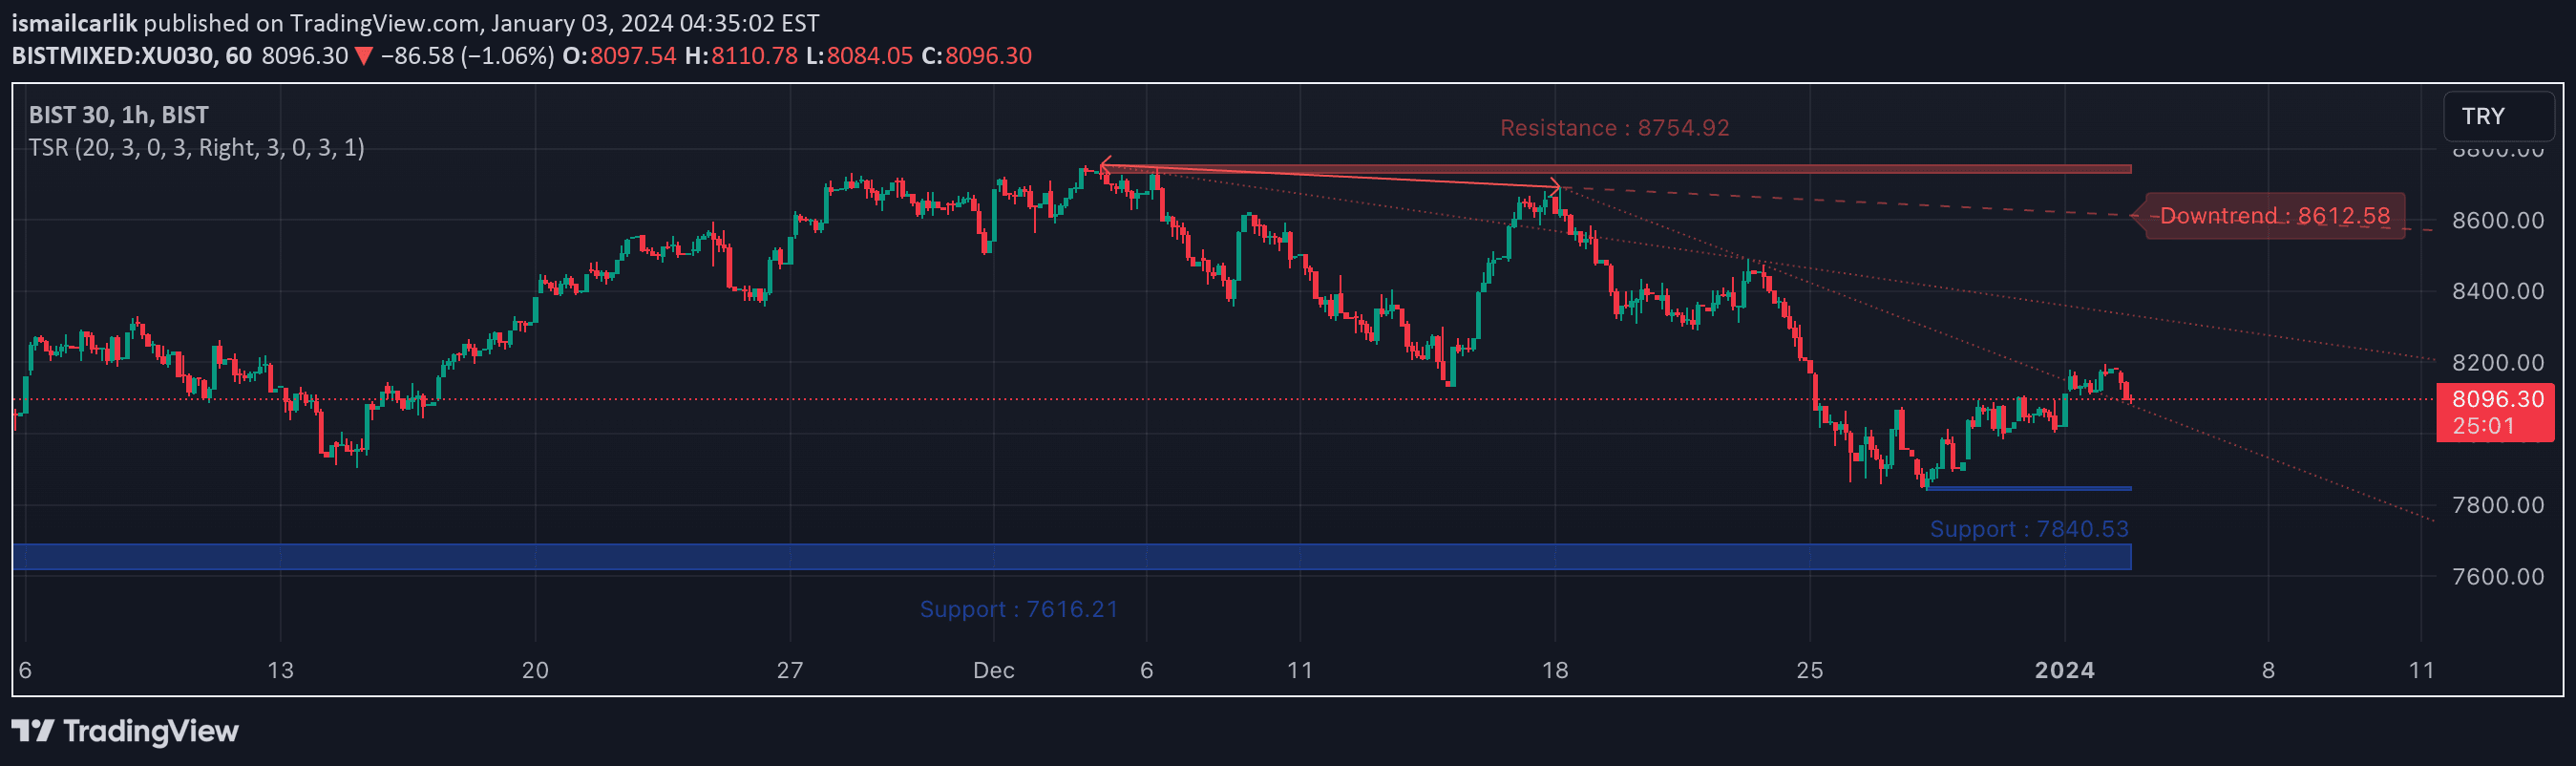
A trend line plotting indicator that identifies key pivot points and draws support and resistance lines to help traders visualize potential price barriers and trend directions.
Explore complementary indicator rolesHow it works
The indicator analyzes price action by detecting significant pivot points based on a configurable lookback period. It identifies pivot highs and lows by comparing price levels within the specified range, marking these points with red and green triangles respectively.
Once pivotal points are established, the indicator automatically draws corresponding support and resistance trend lines. These lines are visualized as dashed lines in red for resistance levels and green for support levels, helping traders understand potential price barriers and trend dynamics.
Why it may be useful
Trend lines are crucial for understanding market structure and potential price reversal zones. By automatically identifying and plotting these lines, traders can quickly assess potential entry and exit points without manually drawing trend lines.
The visual representation of support and resistance helps traders make more informed decisions by providing a clear framework for potential price movements. The configurable settings allow traders to adapt the indicator to different market conditions and trading styles.
When to explore it
This indicator is most effective in markets with clear trending behavior, where prices consistently respect support and resistance levels. It works well across various timeframes, from short-term scalping to longer-term swing trading strategies.
Traders should use this indicator in conjunction with other technical analysis tools to confirm signals and validate potential trade setups. It is particularly useful during range-bound and trending market conditions where identifying key price levels can provide a significant trading advantage.
Keep exploring
What we’ve verified
Access, alerts and repainting behaviour have not been independently verified for this indicator. Check the creator’s current publication and settings.
General descriptions and classifications are recovered research. Verified details above identify the specific checks we have completed. Check the creator’s current publication for later changes.